Category: Statistics

  • Temu Revenue, Growth, Usage and Downloads Statistics for 2025

    Temu Revenue, Growth, Usage and Downloads Statistics for 2025

    Only launched in 2022, Chinese-owned online retailer Temu has exploded on the scene to become one of the biggest online shopping platforms in the world today.

    To better understand Temu’s meteoric rise, their current standing in the eCommerce industry, and where they might be headed in the future, we’ve put together a packet of statistics that tell you all you need to know about Temu, the company looking to disrupt the shopping app market.

    Want weekly insights into how 7, 8 and 9-figure ecommerce brands are driving sustainable growth? That’s what you get with our value-packed newsletter, The Retention Edge. Subscribe for free today.

    What is Temu?

    Temu is an “everything” online shopping platform, selling virtually anything you can think of, from clothing to electronics to patio furniture.

    The platform operates on a marketplace model, like Amazon, where many products are sold by individual third-party sellers. Where Temu sets itself apart is in price, advertising products at ridiculously low prices, such as an $8.99 smart watch, a tank top for $4.47 and a $9.39 dress.

    Accompanying these products are advertisements for savings in excess of 90% off, limited-time deals, and a heavy focus on urgency and scarcity tactics.

    While the press around Temu of late has been more negative than positive, you can’t argue against the platform’s success, currently sitting as the top shopping app in the US for both iPhone and Android, ahead of massive names like Amazon, Walmart and Shein.

    Temu: Key Facts

    Read more: in this article, we take a deep dive into the tactics used by brands like Temu and Shein to keep users hooked, and why mobile apps are at the core of it all.

    Temu & Super Bowl 58

    Many people were introduced to Temu by their high-profile Super Bowl advertisement in February 2024, which is estimated to have cost them $21 million in ad spend alone.

    The company ran three 30-second ads during the most-watched television event since the moon landing. According to Business Insider, these ad spots cost $7 million each, putting their ad spend for 1:30 of airtime at a cool $21 million.

    The $21 million Super Bowl ad spend is not all though; Temu ran three more ads after the game ended, and a company spokesperson stated that the ads were part of a wide campaign that featured “more than $15 million in coupons and giveaways.”

    Key Temu Statistics in 2025

    Now let’s explore some of the most notable Temu statistics you need to know today.

    How Many People Use Temu?

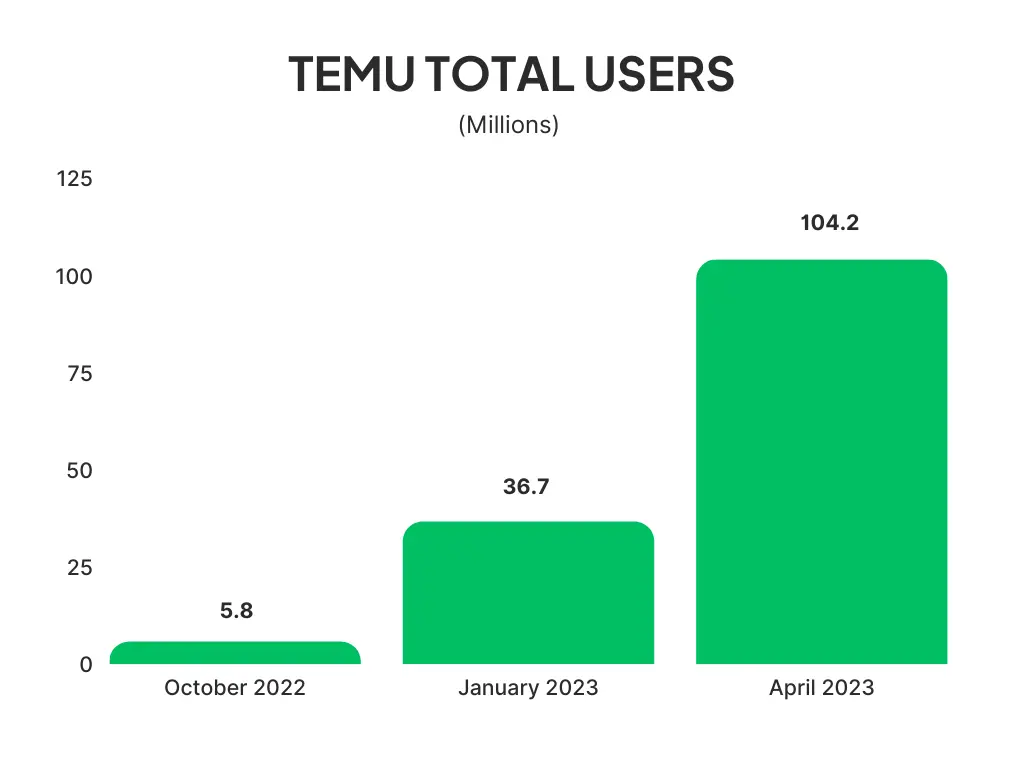
    Temu was only launched in September 2022. In less than a year, the platform already eclipsed 100 million active users in the US.

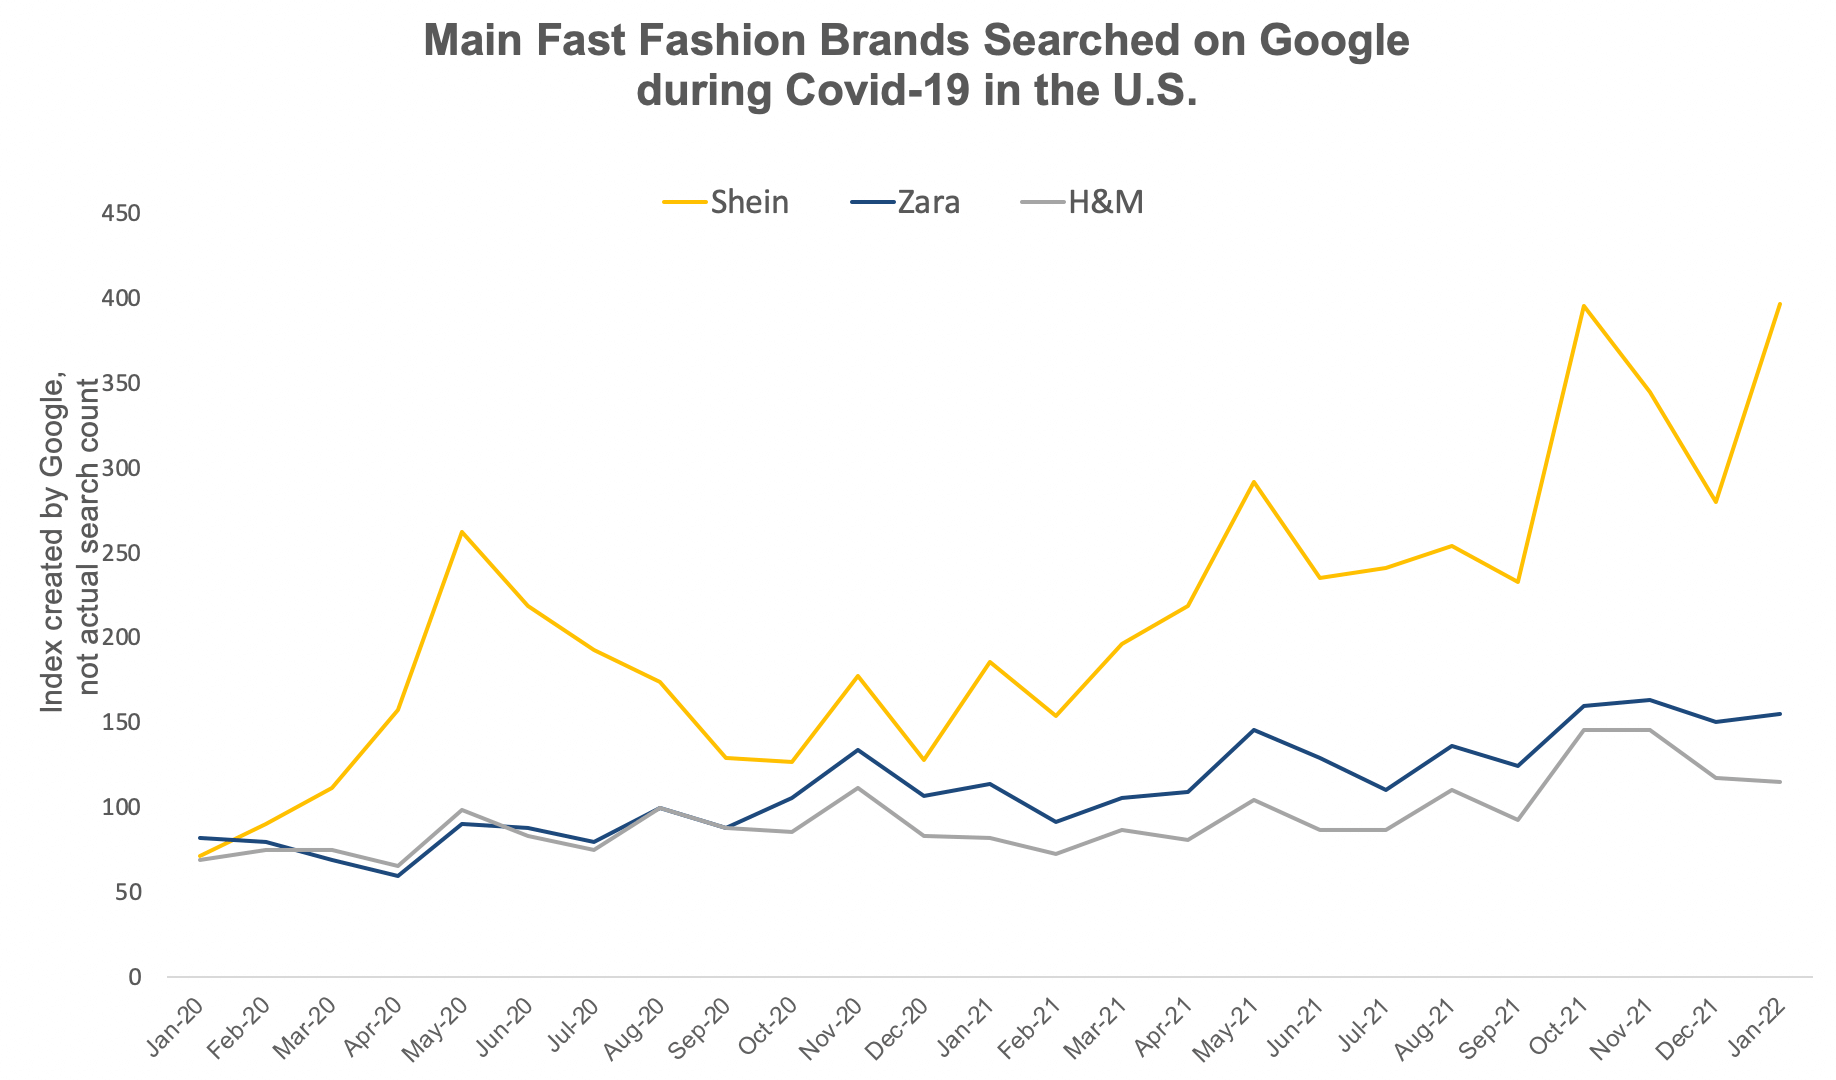
    To put that in perspective, Shein has just 13.7 million users in the US (74.7 million worldwide – fewer than Temu’s user base in the US), while there are 112 million Amazon Prime users in the US.

    Temu Growth: 2022-23

    Obviously, to go from zero to 100 million users in less than a year requires a steep growth curve. Temu’s growth is certainly no exception, going from 5.8 million US users in October 2022 to 104.2 million in April 2023.

    Temu Revenue & Sales

    Temu’s monthly GMV in September 2022 was estimated to be $3 million, jumping to $192 million for January 2023.

    The platform’s revenue has since exploded further, reportedly doing $3 billion in revenue in the first half of 2023. With this figure, we can estimate Temu’s yearly revenue is at least $6 billion.

    For reference, competitor Shein’s annual revenue is $24 billion. Temu’s lower revenue, despite having a higher user base, can be attributed to their focus on low-priced discount items leading to a much lower average spend per customer.

    Both are still significantly behind Amazon, which generates nearly $700 billion globally in revenue per year, as the eCommerce leader in the American market.

    For one more comparison, Temu’s sister company Pinduoduo (owned by the same parent company, PDD Holdings), did the equivalent of US$19 billion revenue in 2022.

    Temu Net Worth

    As Temu is a privately held company, there’s no data available to the public about the company’s net worth.

    We do know that PDD Holdings, Temu’s parent company, has a net worth of $128.79 billion. As Temu makes up a minority of the assets owned by PDD Holdings, we can assume that Temu’s net worth is less than that of Shein ($100 billion), and far behind Amazon, which is worth nearly $1.5 trillion.

    Temu App Statistics

    As of July 2023, the Temu app had over 130 million downloads in the space of less than a year.

    As of the end of 2022, this was sitting at 15 million. The app was reportedly downloaded over 30 million times in the month of July.

    With these numbers, Temu sits as the #1 shopping app in the US in both the Google Play Store and Apple App Store.

    Most of Temu’s downloads come in the US, with a little over 42% of their total app downloads. Temu’s next most popular countries are the UK, France, Germany, Italy and Spain.

    According to Similarweb, the Temu app’s usage rate ranks #3 in the US for the “Shopping” category, and 43rd among all apps.

    Temu Traffic Statistics

    Similarweb estimates Temu.com receives 286.6 million visits per month.

    The site is ranked as the #6 marketplace website in the US, behind Amazon, eBay, Walmart, Etsy and Target.

    Overall, Temu.com ranks as the 72nd biggest website by traffic in the US, and 92nd globally.

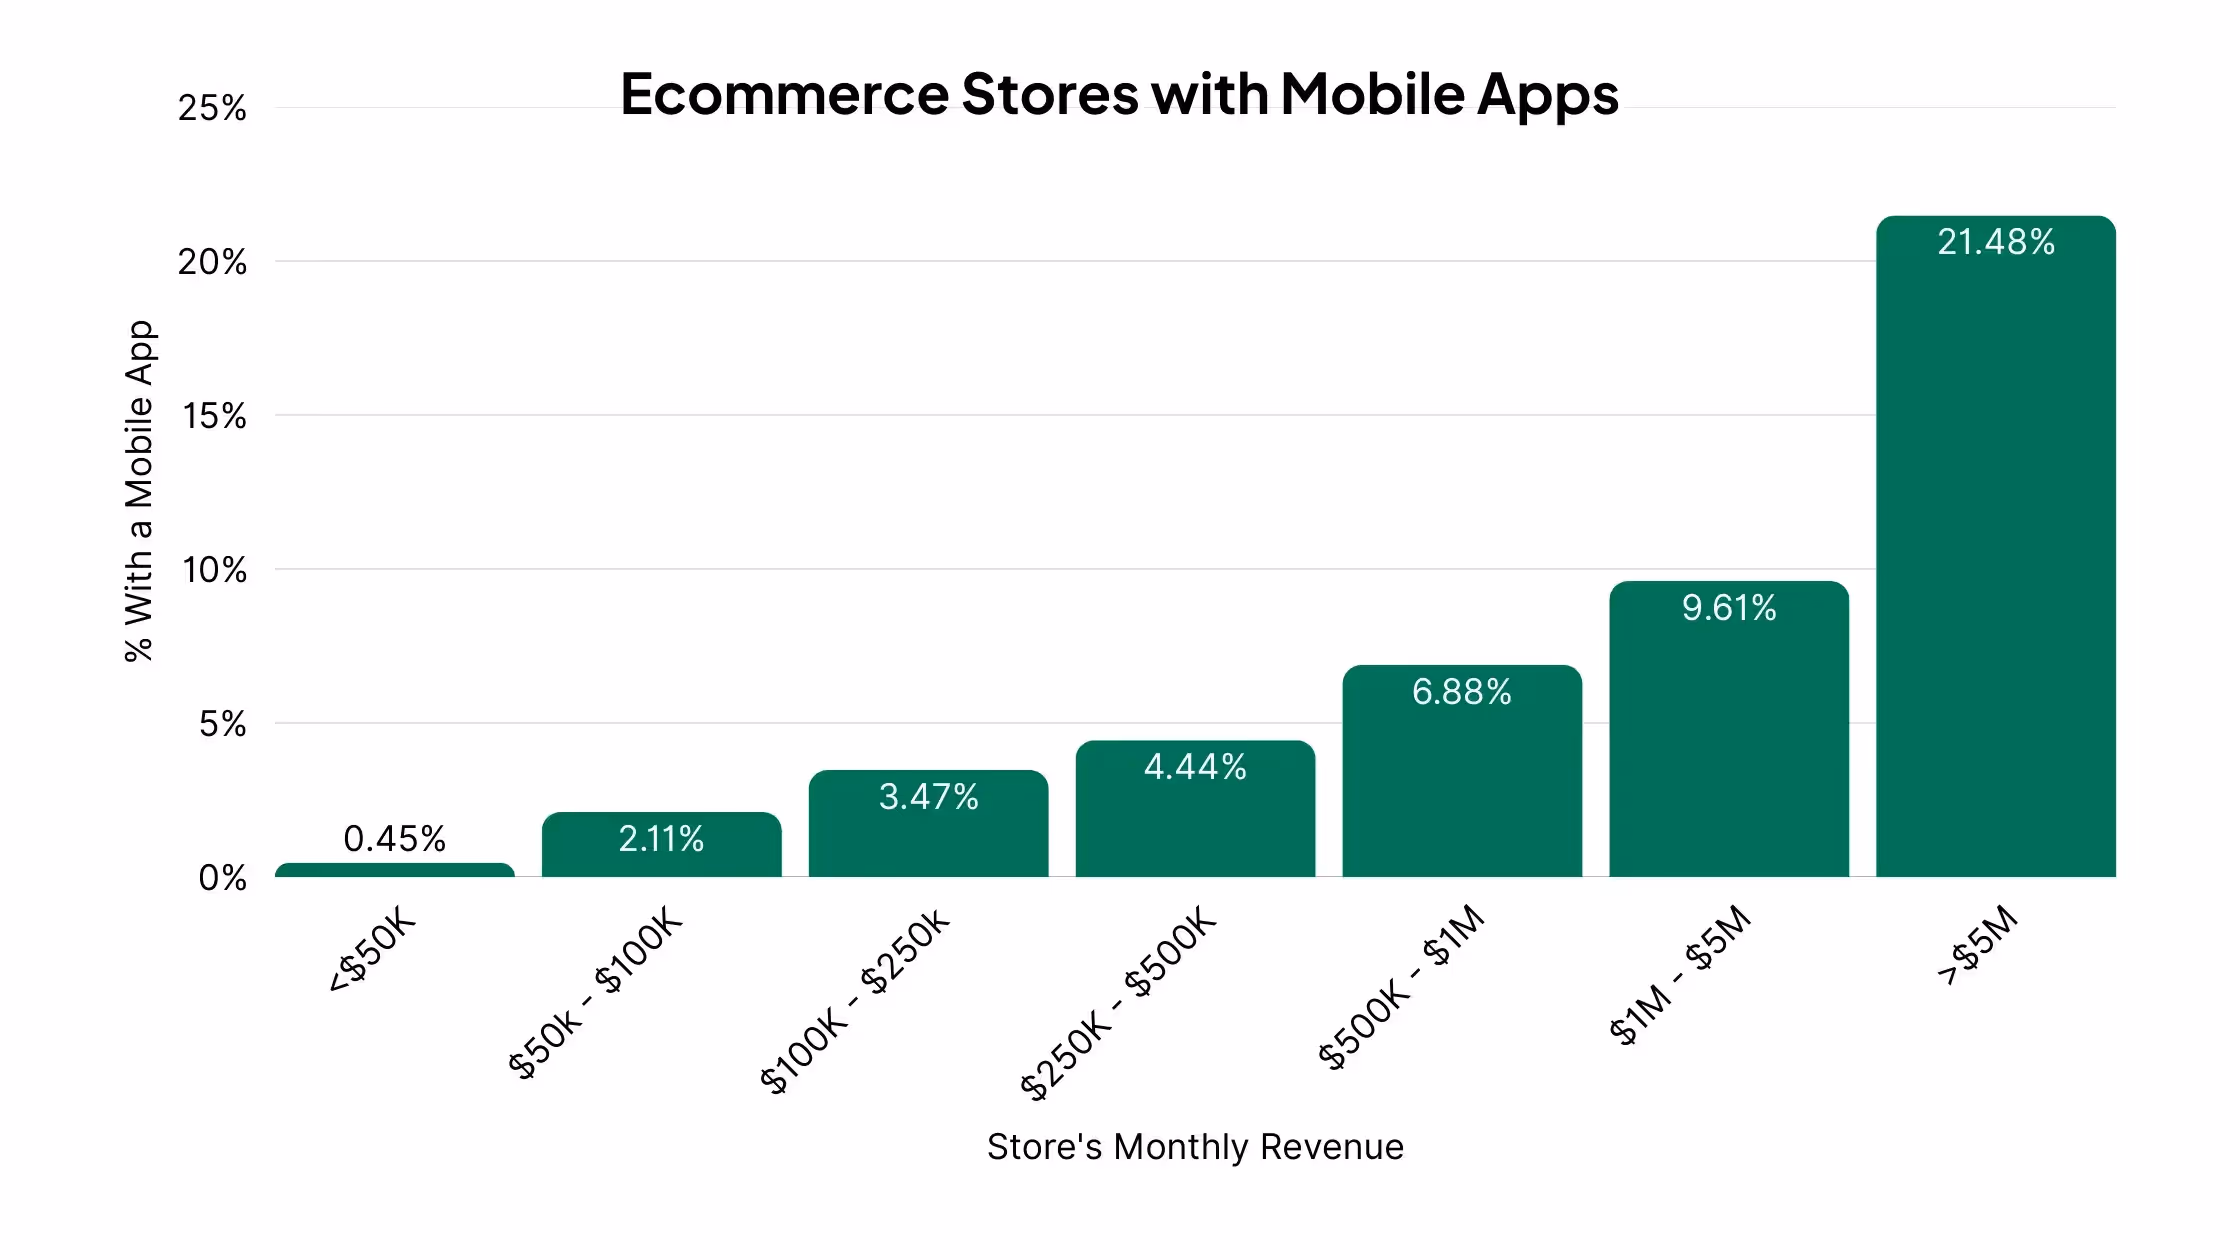
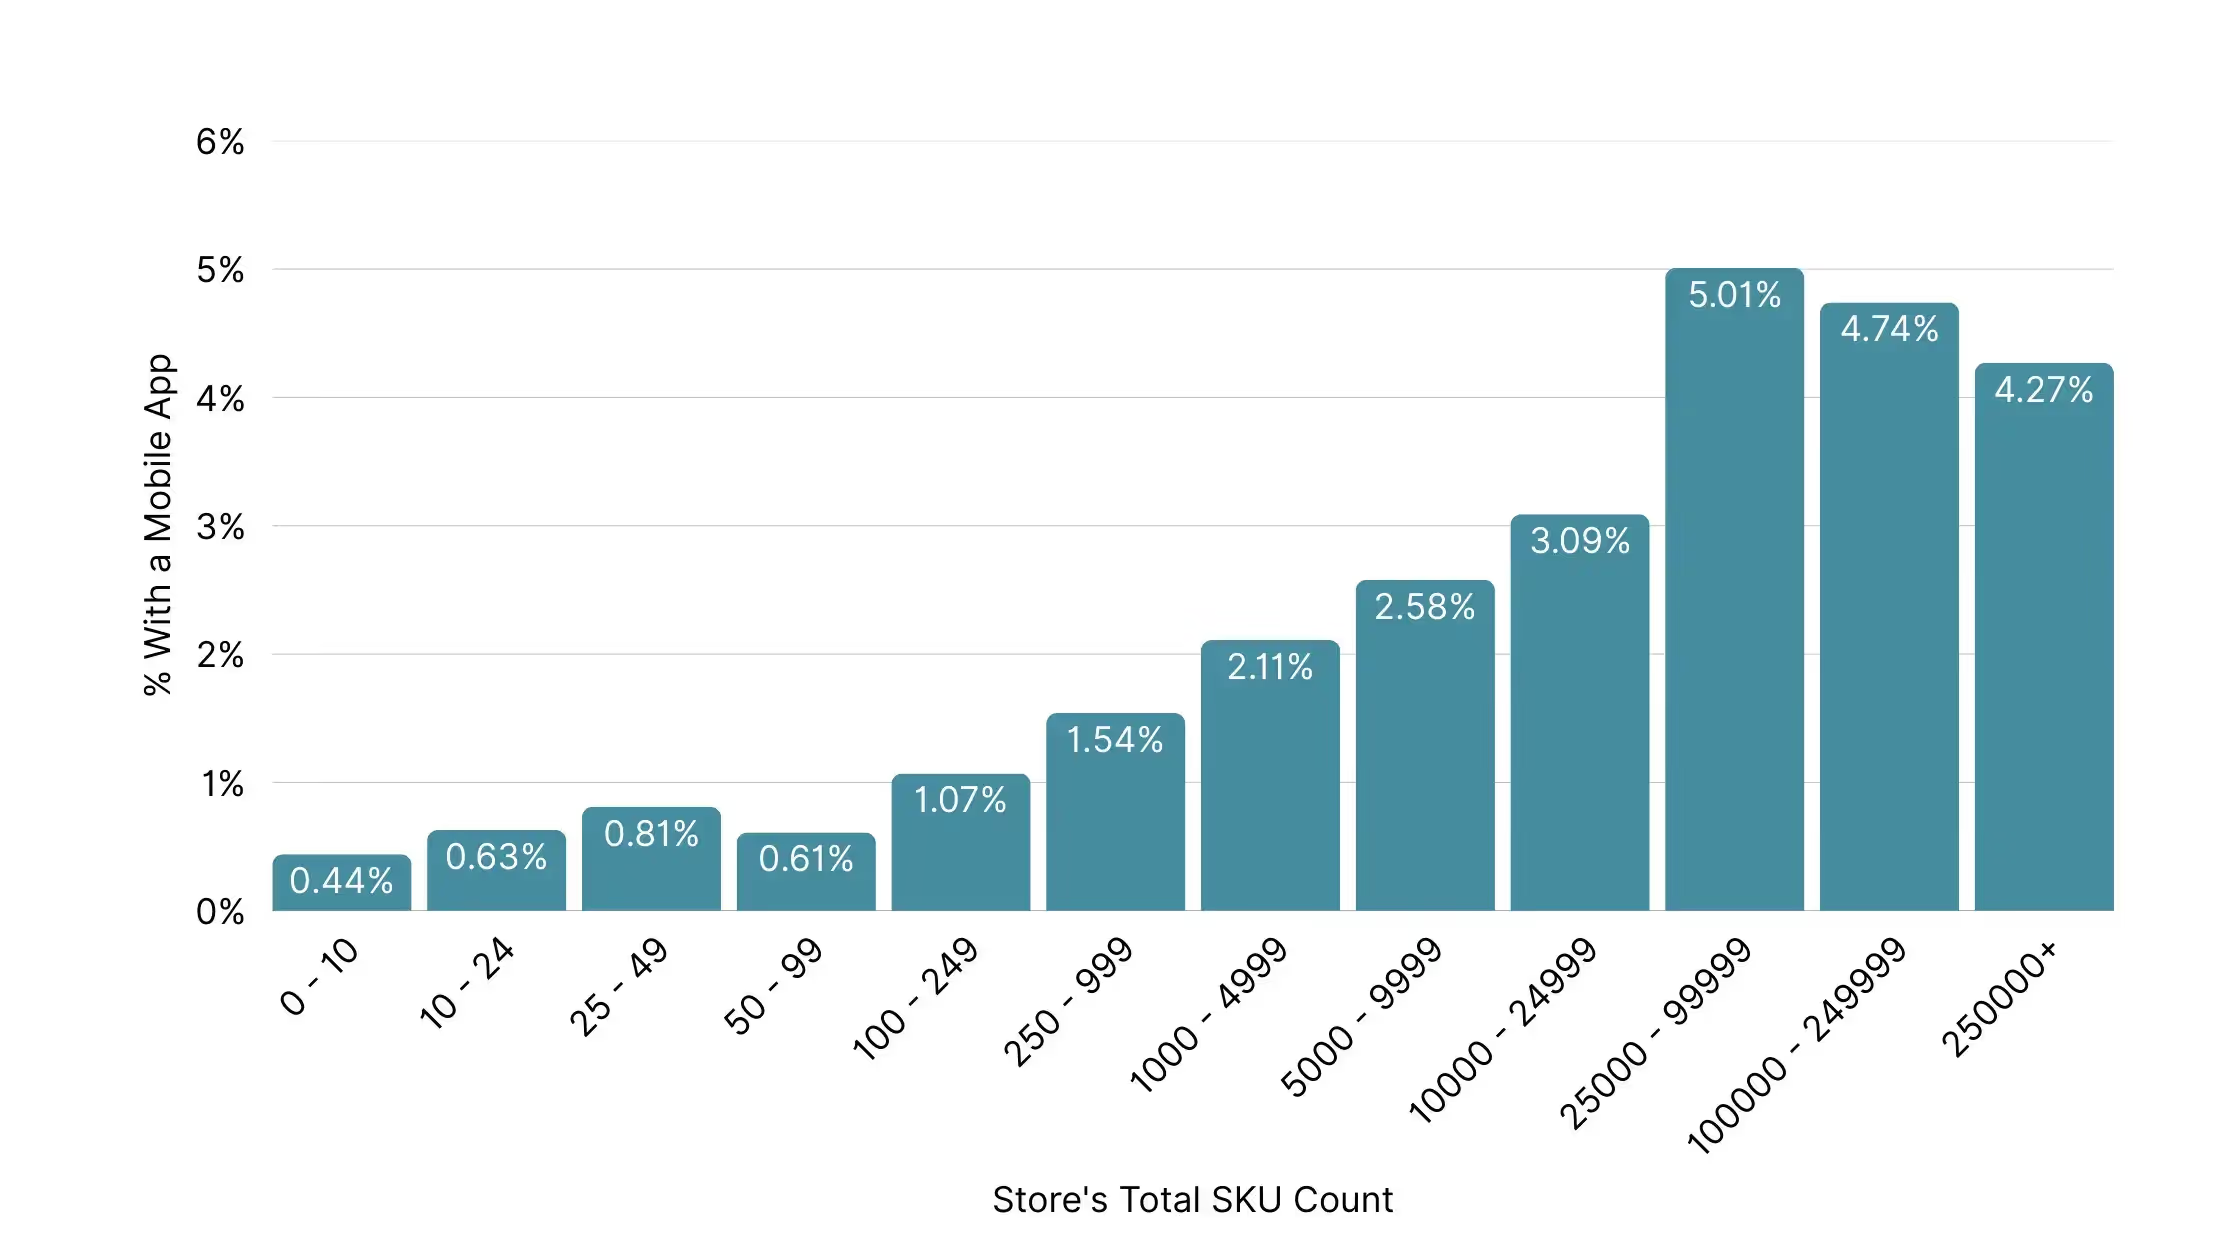
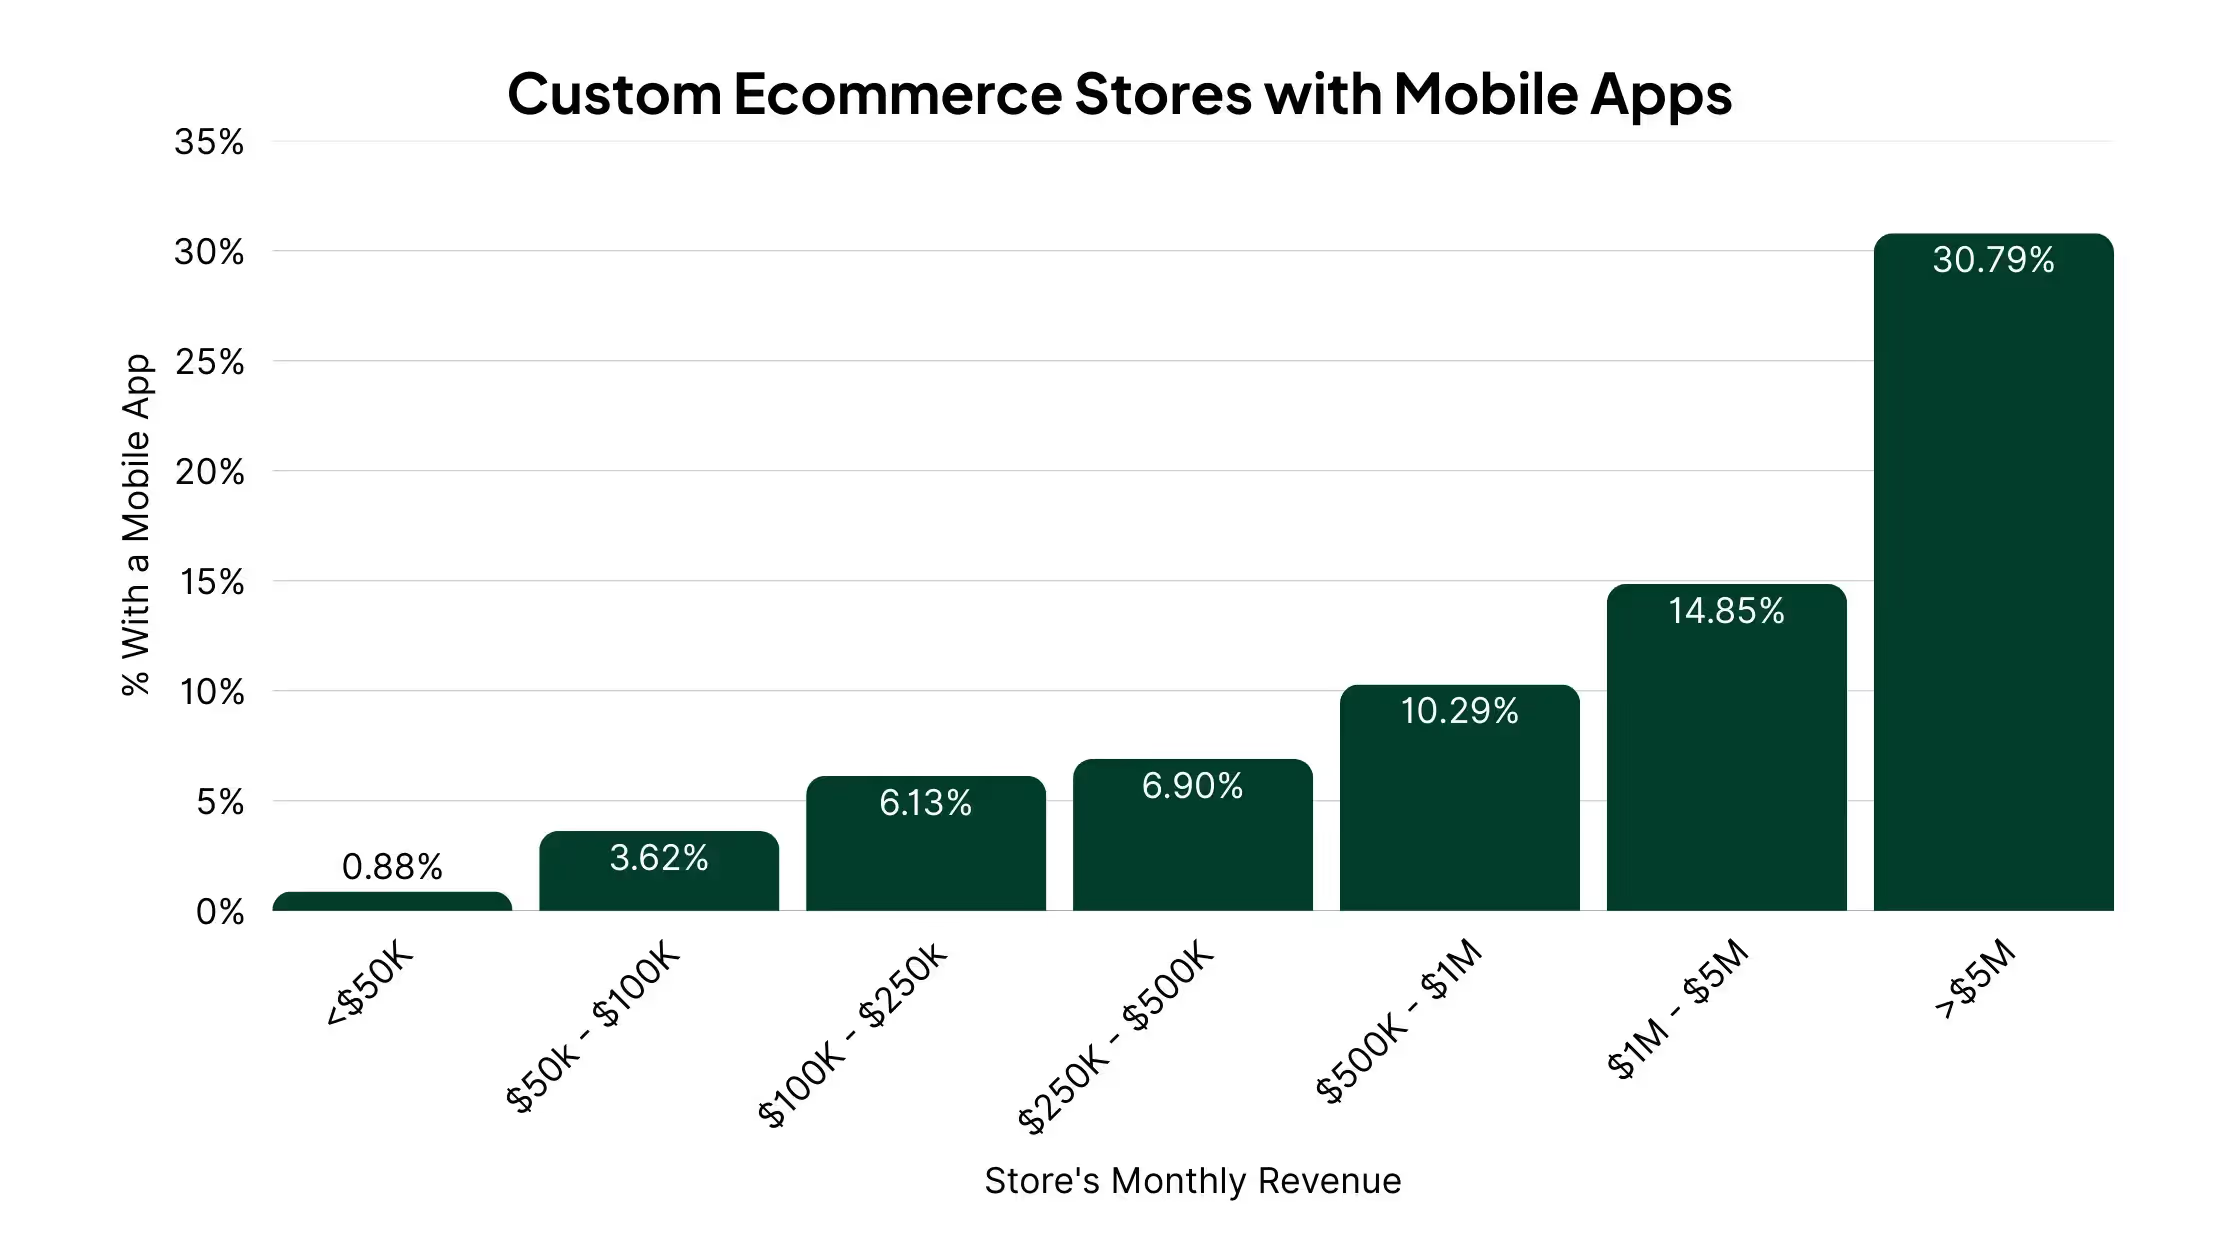
    If you’re running an eCommerce store, and you don’t have an app, you’re missing out. Our eCommerce App Revenue Calculator shows just how much you can gain from launching your own app.

    How Did Temu Get So Big?

    Temu’s ability to source products directly from Chinese manufacturers is a big reason for the platform’s growth, enabling them to sell products at huge discounts and undercut the competition.

    Even though the quality of the products sold on Temu is often questionable, these low prices make consumers willing to take the risk.

    Temu also relies on quite aggressive marketing strategies, such as >90% discounts, gamification tactics, app-exclusive discounts and very persistent notifications.

    __wf_reserved_inherit
    __wf_reserved_inherit

    There are reports of Temu getting in touch with users over 100 times within the space of three weeks, through a variety of channels including push notifications, email and SMS.

    Temu also invests heavily in social media marketing, specifically using influencers to gain visibility on TikTok with younger customers. They also ran multiple advertisements during the 2023 Super Bowl, which was many US consumers’ first introduction to the Temu brand.

    Does Temu Make a Profit?

    It’s believed that Temu does not make a profit at this time. An article on WIRED suggests that the company loses an average of $30 per order, for overall losses of $588 million to $954 million per year.

    This is partly due to the low margins required to sell products at steep discounts, along with their aggressive marketing as the company tries to gain market share in the US, reportedly carrying a marketing budget of $1 billion per month.

    Learn more: see how Temu uses push notifications to drive repeat sales and build a habit of daily use, in this article.

    Will Temu Continue to Emerge as One of the World’s Biggest Shopping Apps?

    Temu carries significantly more controversy with its rise than Shein, another big new player in the eCommerce market.

    Most of what you read about Temu online is negative, from questions about the legitimacy of products for sale on the site, to worker exploitation and data privacy concerns.

    Their user acquisition and marketing strategy is also extremely aggressive, to the point where some may say it’s exploitative.

    Yet despite all this, Temu’s user base continues to grow, and it continues to hold the top spot for downloads in Google Play and the App Store.

    As it currently stands, Temu is unprofitable, and thus their current operating model is unsustainable. Their road to profitability is to build the Temu brand as a household name in the US market, along with bringing in more marketplace sellers to adopt a model similar to Amazon’s.

    However, as long as Temu relies on low-cost, low-quality goods from China, it will always carry a stigma that will prevent it from challenging Amazon as the marketplace eCommerce leader.

    Sources

    Statista | Business of Apps | Tech Buzz China | Macrotrends | AppFigures | Similarweb | WIRED

  • Shein Revenue, Growth, Usage and Download Statistics for 2026

    Shein Revenue, Growth, Usage and Download Statistics for 2026

    In this article, we’ll share all the key Shein statistics and facts you need to know about the fashion company that has quietly become one of the biggest names in online shopping in the world.

    Read on to learn everything you need to know about Shein’s revenue, valuation, app download, and usage statistics, updated for 2026.

    Want weekly insights into how 7, 8 and 9-figure brands are driving sustainable growth? That’s what you get with our value-packed newsletter, The Retention Edge. Subscribe for free today.

    What is Shein?

    Shein (pronounced “She In”) is a Chinese-founded ecommerce company established in 2008 by Chinese billionaire Chris Xu.

    Originally selling wedding dresses under the name “SheInside,” it rebranded to Shein in 2015 and pivoted to ultra-fast fashion.

    Today Shein is an online-only fashion retailer, selling to customers in over 150 countries worldwide. They’re renowned for low prices, a huge selection of product lines and strong appeal with Gen Z shoppers.

    Shein: Key Facts

    • Founded in 2008 in Nanjing, China.
    • Headquarters located in Singapore.
    • Shein originally sourced products from wholesalers in a dropshipping-type model.
    • Shein has since moved to become a fully integrated retailer, managing its own supply chain.
    • Shein’s late-2022 investment round made the company the world’s largest fashion retailer.
    • The company sells to over 150 countries, but does not sell to customers in its “home” country of China.

    Learn more: Shein (and its closest competitor, Temu) relies heavily on mobile apps to keep users hooked and drive sustained revenue from repeat purchases. Check out this article to learn how they do it.

    Key Shein Statistics for 2026

    Let’s explore some more key statistics and facts you need to know about the Shein platform.

    Shein Revenue Statistics

    Shein does not publicly disclose financials, but multiple industry sources have published estimates based on investor documents and partner disclosures.

    • 2022 revenue: approximately $24 billion
    • 2023 revenue: approximately $32.2 billion, with more than $2 billion in net profit
    • 2024 revenue: approximately $38 billion (up ~18% year-over-year), though net profit declined to around $1 billion due to rising competition and logistics costs
    • Q1 2025 revenue: approximately $9.9 billion, partly driven by a surge in orders ahead of the US de minimis tariff changes
    • 2025 full-year estimated revenue: approximately $56 to $60 billion (Shein is private and has not published official results)

    A CNBC report from January 2024 cited a key retail partner stating revenue was “a lot more” than $30 billion annually. For context, Shein holds an estimated 18% share of the global fast fashion market.

    These consistent numbers come after a huge leap around 2020, where Shein went from driving a few billion in annual revenue to breaking the eleven-figure mark.

    How Much is Shein Worth?

    Shein’s valuation has shifted substantially over the past three years.

    • 2019 valuation: $5 billion
    • 2020 valuation: $15 billion
    • 2021 valuation: $30 billion
    • 2022 valuation: approximately $100 billion at its peak
    • 2023 valuation: approximately $66 billion
    • January 2024 valuation: approximately $45 billion, following a fundraising round
    • Pre-IPO discussions (early 2025): potential valuation as low as $30 billion

    The company originally pursued a US stock market listing, but regulatory scrutiny and political headwinds led it to pivot. 

    In April 2025, the UK’s Financial Conduct Authority approved Shein’s application to list on the London Stock Exchange, though Chinese regulatory approval remained pending. 

    Reports from mid-2025 also indicated the company was exploring a Hong Kong listing as an alternative.

    The valuation compression reflects a combination of competitive pressure from Temu, rising logistics costs, and significant regulatory risk from US trade policy changes.

    Shein App Download Statistics

    Shein’s mobile app is one of the most downloaded shopping apps in the world today.

    For several years now, it’s held a consistent place in the top five shopping apps in both the App Store and Google Play store.

    By 2024, the iOS version ranked 5th in the US shopping category, with overall app usage ranking 91st across all app categories in the US.

    The app generated approximately than 235 million downloads in 2025, nearly tripling its yearly downloads since 2019.

    Shein Website Traffic Statistics

    Shein.com is one of the most visited fashion and retail websites globally.

    • Monthly visits (July 2024 peak): over 218 million, per Similarweb
    • Monthly visits (February 2026): approximately 282.8 million
    • Average session duration: 7 minutes 27 seconds
    • Global ranking: 123rd overall (May 2024); #1 in fashion and apparel
    • US share of traffic: approximately 39-40% of total web visitors
    • Other top markets: Brazil (~12%), France (~6.6%), Spain, Canada

    Shein’s traffic source breakdown (2024-2025):

    • Direct: 52-58%
    • Organic search: ~20-25%
    • Paid search: second or third largest channel depending on the period

    Their audience skews female (57.8%) and the largest age group is 25-34 year olds.

    How Many Orders Does Shein Get a Day?

    The exact number of orders Shein gets is not publicly known at this time. However, we can put together a rough estimate.

    Shein’s average order value is $75, according to ChinaTalk. If they did $60 billion in revenue in 2025, we can estimate that they did 800 million orders over the year, which would equal roughly 2.2 million orders per day.

    How Many Products Does Shein Sell?

    Shein is estimated to have as many as 600,000 products for sale at any given time.

    This number features significant turnover, with the company releasing over 300,000 new products every year. In comparison, H&M (another leading fast fashion retailer) releases approximately 4,500 new products per year.

    Shein’s manufacturing rate is helped by the use of AI to analyze trends and create new designs, and over 3,000 suppliers working in partnership with the company.

    Shein Brands

    Like Amazon, Shein owns a number of private label brands. These brands are sold on both the Shein platform (alongside Shein branded clothing) and independent branded websites. Shein currently owns the following brands:

    • MOTF: a “business-chic” clothing line providing high-quality professional clothing for women.
    • ROMWE: “dark pop” pieces and social styles that have been seen on platforms like TikTok and Instagram.
    • SHEGLAM: an affordable beauty and cosmetics brand.
    • DAZY: a trendy streetwear label for both women and men.
    • EMERY ROSE: a “cottagecore” style clothing line featuring smart-casual clothes for women.
    • CUCCOO: a discount womens’ footwear brand.
    • Luvlette: a womens’ underwear, lingerie and sleepwear brand.
    • GLOWMODE: stylish and versatile activewear for women.
    • PETSIN: a pet clothing and accessories brand.
    • JMMO: tech devices and accessories.

    How Many Countries is Shein Available In?

    Shein is currently operating in over 150 countries, per their website.

    How Many Employees Does Shein Have?

    Shein employs nearly 10,000 workers worldwide, with 58% of Shein employees female and 42% male.

    Why is Shein So Popular?

    We know from the statistics above that Shein is now one of the biggest names in ecommerce, with one of the most popular shopping apps in the world.

    So how did Shein go from a relatively unknown brand to the biggest fast fashion retailer in the world, surpassing the likes of H&M, Zara and ASOS?

    Here are a few reasons why.

    Low Cost

    One of the first reasons we can look at is cost.

    For a few reasons, such as their online-only business model (removing the overhead expense of managing physical stores) along with low-cost sourcing from Chinese manufacturers, Shein is able to offer products at ridiculously low prices.

    A snapshot of the prices offered for contemporary fashion on Shein

    The average product on Shein is reported to cost only $9. You can find quality products on Shein for less than half of what you’d generally pay from other retailers. This makes the platform extremely attractive to discount-hungry young shoppers.

    Range

    The platform also features a huge range of products, with over 600,000 styles available on the site, as mentioned earlier. Their business model and manufacturing connections allows them to constantly produce new products and outpace the competition in the fast fashion industry.

    On-Demand Production

    It’s not just the range of products they offer, it’s the fact that the product lines Shein sells are constantly turning over and always fresh.

    Shein utilizes AI technology and a team of in-house designers to pump out new designs and try to get ahead of the latest trends. But the key thing is that they only produce 100-200 new pieces of each item at launch.

    If it’s not popular, they don’t create any more. If a line does catch on, they can mass-produce it.

    This allows them to offer an incredible range, with 500-2000 new products per day, without being bogged down by unsaleable inventory from product lines that don’t sell.

    Pandemic eCommerce Boom

    The pandemic undoubtedly played a big part in Shein’s rise as well.

    Their user base nearly tripled from 2019 to 2020, then nearly tripled again in 2021, coinciding with eCommerce booming as most people were forced to stay home, and physical retailers were closed.

    Google trends shows a steady increase in Shein’s search popularity over this time, significantly above competitors like Zara and H&M.

    Image via Daxue Consulting

    Gamification

    Shein intensely pushes gamification tactics incentivizing users to spend more time shopping and buy more products on the site or the app.

    This includes huge sales (sometimes as much as 80% off), first-time shopper discounts, discounts for downloading their app and reward points earned for buying products and contributing product reviews.

    Social Influencers

    Finally, and possibly one of the biggest reasons for Shein’s rise, is their social media presence and the social media influencers promoting the platform.

    Shein is constantly being promoted on TikTok, with hashtags such as #shein and #sheinhaul generating billions of views.

    In these posts, creators purchase sometimes as much as a thousand dollars worth of clothing from Shein to show off to their followers. These creators generally receive a commission for sales they refer from their posts.

    The same goes on other social media platforms like YouTube and Instagram, and from independent fashion blogs.

    This strategy has helped Shein take off with Gen Z shoppers in particular, who make up 50% of the retailer’s customers.

    Push Notifications

    Shein relies heavily on push notifications to drive user engagement.

    As well as event-driven messages like abandoned cart notifications, Shein sends numerous messages to app users to try and entice them into the app to start shopping again.

    It’s not uncommon to receive 10+ notifications per day from the app, which does a great job of keeping the Shein app and brand top-of-mind.

    Learn more about how brands like Shein and Temu use push notifications to drive engagement and build a regular shopping habit in this article.

    Shein’s Future Outlook

    Shein enters 2026 in a materially different position than it held at its 2022 peak. Revenue continues to grow, but at a lower margin and with greater regulatory complexity.

    The company’s full-year 2025 revenue target of $56 to $60 billion would represent continued growth, but it depends on successfully navigating tariff costs, maintaining competitive pricing, and closing an IPO that has been delayed multiple times.

    The marketplace model expansion, combined with warehouse infrastructure built outside of China, signals a strategic pivot toward a supply chain less dependent on Chinese direct-ship economics. How far that transition goes, and whether it can preserve Shein’s core price advantage, will determine its trajectory as a public company.

    —-

    Statistics sourced from Business of Apps, Backlinko, Priori Data, Similarweb, CNBC, NPR, Fortune, and Statista.

  • How Many Ecommerce Stores Have a Mobile App?

    How Many Ecommerce Stores Have a Mobile App?

    Mobile commerce is estimated to account for nearly 70% of all ecommerce sales worldwide (and fast approaching these numbers in the US too).

    With more consumers shopping on their smartphones, mobile apps are becoming a bigger and bigger opportunity for ecommerce brands.

    Apps offer deeper engagement, greater retention, and consistently deliver higher LTV on a user by user basis.

    But how many ecommerce businesses are taking advantage of this? If you don’t have an app yet, are you behind the curve? Or is there still space to be an early mover?

    Read on and find out.

    Vendrux helps you create the perfect, high-ROI ecommerce mobile app, by converting your existing website.
    Want to learn how? Start with a free preview of your app now.

    Ecommerce Mobile App Adoption by Business Size

    Only 0.66% of US ecommerce stores have a mobile app.

    However, this number is heavily skewed by many small online stores, making little revenue (and thus too small or early-stage to think about mobile apps).

    It’s better to look at how many ecommerce stores have mobile apps, by revenue tiers:

    • Under $50K/month in revenue: less than 0.5% have an app
    • $100K-$250K/month: around 3.5% have an app
    • $1M-$5M/month: nearly 10% have an app
    • $5M+/month: over 21% have a native app

    Notably, among ecommerce stores with $100K+ in monthly revenue, 4.56% of stores have a mobile app.

    App Adoption by Product Catalog Size

    A strong factor in whether a store launches a mobile app is how many products they sell. The more SKUs (stock keeping units) a store has, the more likely they are to invest in an app.

    Here’s what the data shows:

    • Stores with fewer than 50 SKUs: Adoption is low, between 0.4% and 0.8%
    • 50-249 SKUs: Slight uptick, ranging from 0.6% to 1.1%
    • 250-999 SKUs: 1.5% have an app
    • 1,000-4,999 SKUs: 2.1%
    • 5,000-9,999 SKUs: 2.6%
    • 10,000-24,999 SKUs: 3.1%
    • 25,000-99,999 SKUs: 5.0%
    • 100,000-249,999 SKUs: 4.7%
    • 250,000+ SKUs: 4.3%

    This shows a clear pattern: stores with larger product catalogs are more than 10 times more likely to have an app compared to stores with just a handful of SKUs.

    App Adoption by Platform

    Not all ecommerce platforms are equal when it comes to mobile apps. Some make it easier than others.

    Here’s what the data shows:

    • Shopify: Fewer than 0.5% have a native app
    • WooCommerce: Around 1.2% of stores have an app
    • Magento: Higher adoption at 2-4%, mostly among larger brands
    • Salesforce Commerce Cloud (SFCC): Over 6% of stores have an app, many of them custom-built
    • Other platforms (Wix, Squarespace, BigCommerce, etc.): App adoption is generally under 1%, with Wix & Squarespace under 0.4%
    • Custom ecommerce sites: slightly higher than average at 0.88% app adoption

    If we only take stores with roughly 7 figures+ in revenue ($100K+ per month), we find that:

    • 4.24% of Shopify stores have an app
    • 4.38% of WooCommerce stores have an app
    • 2.08% of Squarespace stores have an app
    • 8.50% of custom-built ecommerce stores have an app

    Takeaways:

    Shopify and WooCommerce are the largest, most general-purpose ecommerce platforms, so it makes sense that the average app adoption for these merchants would be around the overall average.

    Stores on platforms like Magento and Salesforce Commerce Cloud, or those with custom-built sites, typically have either bespoke shopping experiences, or are enterprise-focused brands, which make them more likely to have mobile apps.

    On the other hand, platforms like Squarespace and Wix are typically more beginner-focused, so these are smaller-scale stores that are less likely to invest in mobile apps.

    Vertical Trends: Which Categories Dominate Mobile Apps

    Mobile apps make a lot more sense in some industries than others. That’s because apps work best when customers shop often, stay loyal, and want the convenience of being able to shop on-the-go.

    Here’s how app distribution breaks down by several notable product categories:

    • Apparel & Fashion: 13.20% of ecommerce apps fall in this category
    • Food & Drink: 12%
    • Beauty & Fitness: 9.55%
    • Health: 6.92%
    • Home & Garden: 6.86%
    • Sports: 5.64%
    • Consumer Electronics: 4.18%
    • Autos & Vehicles: 3.33%
    • Pets & Animals: 1.91%
    • Travel: 1.82%
    • Toys & Hobbies: 1.28%

    Takeaway:

    The most common type of store to have an app is one selling lifestyle products that people buy regularly or engage with often. 

    • Fashion brands use apps to drop new collections and send push alerts for sales.
    • Beauty brands use them for subscriptions, reorders, and content like tutorials.
    • Food and drink apps support delivery, subscriptions, or loyalty programs.

    On the flip side, brands selling big-ticket or one-time purchase items (like mattresses, appliances, or niche electronics) are less likely to build apps. Their customers don’t shop often enough to justify it.

    Apps make more sense when there’s a need for fast reordering, strong branding, or community, which is why they’ve caught on in fashion and beauty first.

    Data sourced from Store Leads

    What’s Holding Brands Back from Launching Mobile Apps?

    Only 0.66% of US ecommerce stores have an app. And even among stores doing roughly $1M in annual revenue, only 4.56% have an app.

    Why is adoption so low?

    Let’s look at a few reasons.

    Perceived cost

    Many assume apps still come with a massive price tag ($100K+, over months of development). 

    As the wording suggests, this was true at one time. Now, however, it’s easy to go live with your own branded mobile app for around $1-2K, and just a few hundred dollars per month after that.

    Technical complexity

    Along with the cost, teams think they’ll need developers to maintain the app. They expect that the app will come along with a dedicated team to manage it, bringing both cost and operational overhead.

    Again, that’s not true anymore. With a web to app service like Vendrux, you can maintain a beautiful native app with zero development expertise or operational lift from your team.

    “Our mobile site is good enough”

    A lot of brands believe that, because they have a mobile website that looks good and works well, there’s no need for a mobile app.

    Your mobile site is most important – but the app is not supposed to replace the website. It’s supposed to be a home for a brand’s most engaged, loyal fans, who want a more convenient way to make regular purchases.

    Smart brands (as you’ll see from the stats – brands that do more revenue are more likely to have apps) recognize this, and offer a mobile app for their loyal, VIPs.

    “No one will use the app”

    Some are skeptical that customers will download and use the app.

    It’s true that not all customers prefer to use an app. New visitors will land on the brand’s website. And some would rather keep using the website than downloading an app.

    But brands that launch apps typically see ~10% of their customers jumping on the app – and these tend to be the most engaged, valuable customer segments.

    Misconceptions about mobile apps

    A lot of brands hold misconceptions about mobile apps. They cost too much. Too much work to manage. Mobile apps don’t work.

    These concerns are real, but often based on old assumptions.

    Modern solutions (like Vendrux) eliminate these barriers. You don’t need to rebuild your site, hire developers, or maintain two platforms. Your website powers the app, everything stays in sync, and our team handles all the setup and launch.

    You get the benefits for retention, engagement and LTV, without adding more work for your team.

    Want to see what your website could look like as an app? Find out now with a free, interactive preview of your website as an app.

    Forecast: What’s Next for Mobile Apps?

    Mobile apps aren’t just for the biggest brands anymore. The landscape is shifting, and fast.

    Here’s how the mobile commerce world is changing, and why it points to apps as a key area of focus for modern brands:

    • Mobile commerce is taking over: the majority of ecommerce traffic comes on mobile. And this share is only going to keep growing.
    • Acquisition costs are rising, brands are looking for lower-cost, higher-return channels – like mobile apps.
    • Email deliverability is declining, SMS is effective but expensive, and brands need low-cost, high-visibility channels like mobile app push notifications to keep in contact with their customers.
    • You no longer need to spend months and six figures building an app. Once more businesses realize this, we’ll see more trying an app.
    • Customer expectations: Shoppers are used to the speed and ease of Amazon, Shein, Temu, and TikTok Shop, and expect similar from all brands.

    For now, mobile apps remain a competitive edge. But in the near future, they’ll become table stakes, especially for high-frequency brands serious about retention and customer lifetime value.

    Conclusion: The Opportunity in the Gap

    Fewer than 1% of ecommerce stores currently have a mobile app.

    These numbers rise once you remove small-scale stores, with nearly 5% of US brands doing $100K or more in monthly revenue having their own mobile app (and a higher percentage for brands on Salesforce, Magento, and custom/headless builds).

    But for brands ready to grow faster and retain more customers, this is still a major opportunity.

    Native apps aren’t just about looking good in the App Store. They give you:

    • A direct line to your best customers
    • Low-cost, high-visibility communication with push notifications
    • A faster, smoother shopping experience that boosts conversion
    • A branded space that builds loyalty and keeps you top of mind

    Today, launching a mobile app is faster, simpler, and more accessible than ever, with solutions like Vendrux making it possible in just a few weeks.

    Mobile apps aren’t a luxury anymore. They’re a great strategic play for just about any brand, and more accessible than ever, whether your brand is VC-funded or lean and bootstrapped.

    Want to see what’s possible? Get a free preview of your mobile app now.

  • The Latest Black Friday Statistics: $41.1 Billion Online Sales

    The Latest Black Friday Statistics: $41.1 Billion Online Sales

    The latest Black Friday statistics shine a light on how the days following Thanksgiving have grown to become the most important period of the year for retailers.

    We’ve almost come to think of Thanksgiving as the day before Black Friday, rather than the other way around.

    Though Black Friday is nothing new – it’s been a thing since the 1970s, and possibly even earlier – the way we shop on Black Friday and subsequent days is evolving every year, from more people taking advantage of Black Friday-Cyber Monday sales, to a higher share of sales online and on mobile devices.

    If you’re interested in what the data shows about how we shop during the biggest shopping event of the year, read on for the latest statistics.

    Want to learn how to drive low-cost sales and better retention this Black Friday? Get the 2025 BFCM Mobile App Playbook to learn why apps are a competitive advantage, and how to ace Cyber Week with mobile apps & push notifications.

    2024 Black Friday Shopping Statistics

    According to the data, Black Friday (and the surrounding days, including Thanksgiving, Cyber Monday, and the newly coined “Small Business Saturday”) is bigger than ever.

    Check out the following statistics from the most recent Black Friday/Cyber Week to get an idea of just how massive this period is for retailers, as well as getting an idea of what consumers’ shopping habits look like at the unofficial start of the holiday shopping season.

    More than 1 in 2 Americans shop online or in-person during Cyber Week

    In 2024, 197 million Americans made a purchase during Cyber Week, either online or in person.

    That’s approximately 59% of the entire US population.

    This figure is down slightly from 2023, where a record 200.4 million Americans participated in Cyber Week.

    In-Store Shopping Up, Online Down

    In a slight reversal of trends, 2024 saw more people shopping in person, and fewer online.

    126 million people made a purchase in-store during Cyber Week, up from 121.4 million in 2023.

    124.3 million Americans made a purchase online, down from 126 million in 2023.

    Online Shopping Wins on Black Friday

    The distribution flips for Black Friday – 87.3 million Americans made a purchase online, compared to 81.7 million in-person.

    The figures are closer than the previous year, however, where we saw 76.2 million consumers shop in-store compared to 90.6 million online.

    64 Million People Shopped Online on Cyber Monday

    64.4 million people made a purchase online on Cyber Monday 2024, making it the second biggest day for ecommerce.

    This number was down from 2023, which saw 73.1 million online shoppers on Cyber Monday.

    A Record $41.1 Billion Was Spent Online During Cyber Week

    Despite a decrease in overall shoppers, online sales for the “Cyber 5” period were up, setting a new record for Cyber Week sales in the US.

    Shoppers spent $41.1 billion total across the period from Thanksgiving to Cyber Monday – up from $38 billion in 2023.

    New Online Sales Records for Black Friday and Cyber Monday

    Yet again, the two biggest days of the Cyber 5 set new records for online sales.

    US shoppers spent $10.8 billion online on Black Friday, up from $9.8 billion in 2023.

    Cyber Monday online sales totaled $13.3 billion, up from $12.4 billion a year ago.

    Sales on Thanksgiving itself, as well as the Saturday-Sunday period, also set new records. 

    Global Cyber Week Online Sales Top $300 Billion

    Worldwide, online shoppers spent $314.9 billion during Cyber Week, according to a report from Salesforce, up 6% on the previous year.

    Black Friday contributed $74.4 billion in online sales (increase of 5% YoY), while Cyber Monday contributed $49.7 billion (up 2% YoY).

    Mobile Continues to Grow

    Mobile commerce is not slowing down.

    Mobile first beat out desktop in 2022, accounting for 51% of all online sales during Cyber Week.

    The mobile shopping market share grew again in 2023, reaching 51.8% of all online sales.

    And it continues to rise.

    57% of all US online sales on Cyber Monday came on mobile devices – $7.6 billion in total, and a 13.3% increase YoY.

    Worldwide, 70% of online spending came on mobile, up from 67% in 2023.

    Mobile accounted for 57% of all online sales on Cyber Monday 2024, and 70% of all online spending worldwide during Cyber Week.

    US holiday season sales expected to top $1 trillion

    Experts predict a total of $1.353 billion in US retail sales over the holiday season for 2024, up slightly from the previous year.

    19.7% of these sales happen online, meaning over $266 million in US ecommerce sales over the holiday period.

    Nearly $1 Billion Spent with Buy Now Pay Later on Cyber Monday

    Buy Now Pay Later (BNPL) services inch closer to driving $1 billion in sales on Cyber Monday alone.

    In 2024, consumers spent $991.20 million – an increase of 5.5% on the previous year.

    Of these sales, 75.2% came on mobile devices.

    Consumers spent $15.7 million per minute during Cyber Monday peak

    At the peak hour of 10pm-11pm EST on Cyber Monday, consumers spent a massive $15.7 million per minute.

    AI having a major impact on Cyber Week shoppers

    Analysis from Salesforce found AI to be a major player in online shopping during Cyber Week.

    $60 billion worth of global online sales was influenced by AI in some way.

    Retailers that used generative AI and AI agents 18% more during Cyber Week than the week before. Those who did use AI reportedly had 2% higher conversion rates than retailers not using AI.

    Shoppers leaned heavily on AI to assist their purchasing journey too, using AI-powered customer service agents 38% more than the previous week.

    Average order value for November 2023 was 2.7% higher than 2022

    Consumers are spending more in each order than the previous year.

    Between November 1 and November 27 2023, average order value was 2.7% higher than the same period the previous year.

    The increase is even higher over Thanksgiving weekend, with a 3.2% increase in AOV for the period of 25-26 November.

    82% of people shop during Cyber Week

    More than four out of five people say they shop at some point during Cyber Week, whether it’s online, in-person, or both.

    2.5x as many people shop online vs in-person

    Of these people, the majority say they plan to shop online. 68% of people shop online during Cyber Week, while only 27% shop at a brick and mortar store.

    52% of those who don’t plan to shop on BFCM say it’s because they don’t like crowds

    For people who don’t plan to shop during Cyber Week, more than half say it’s to avoid crowds.

    Some simply aren’t interested in buying anything, or don’t want to spend money, while 8% think that Black Friday is a scam.

    Target and Walmart are the top in-person Black Friday shopping destinations

    For people who shop  in-person on Black Friday, more than two-thirds shop at Target, Walmart or both.

    Kohl’s is the next most popular destination, with 41%, while Macy’s, Best Buy and Old Navy are a few other brands that get a spike in business on this date.

    88% of people shop on Amazon on Black Friday weekend

    Of people who shop online during Cyber Week, nearly all make a stop at Amazon.com.

    88% of people report shopping on Amazon at some point during the period. Target (55%) and Walmart (51%) are also popular with the online crowd, as are the websites of some other big brick and mortar brands.

    23% of people plan to spend over $1,000 this holiday season

    Nearly a quarter of people say they plan to spend more than $1,000 this holiday season. 45% of people claimed they will spend $600 or more.

    Consumers spent an average of $321.41 on holiday-related purchases during Thanksgiving weekend

    Thanksgiving marks the start of the holiday shopping season, with an average of $321.41 spent on holiday-related items during this period.

    Most popular gift purchases include clothing and accessories, toys and gift cards.

    55% of people took advantage of pre-Thanksgiving sales

    With Black Friday weekend becoming more and more competitive, many brands opt to start their promotions earlier to get in front of the pack.

    It seems customers are responsive to this strategy, with 55% of people saying they made a purchase from an early sale or promotion.

    Promotions are coming earlier and earlier too, with 35% of people buying something on sale in the week leading up to Thanksgiving, and 24% more than a week before.

    Major categories see up to 2-2.5% more sales during Cyber Monday

    It’s no surprise that Cyber Monday sales are much higher than the average day. 

    Most categories see double their regular sales on Cyber Monday, or more. Apparel sales, for example, grow 189% compared to a regular day in October.

    Other top-performing categories include appliances (up 166%), toys (up 140%) and furniture (up 129%).

    Discounts hit record highs in 2023

    Discounts are hitting record highs during Black Friday and the surrounding days.

    The average Black Friday discount for electronics was 31% off in 2023, compared to 25% off the year before.

    The average discount for furniture increased from 8% in 2022 to 21% in 2023. Apparel, sporting goods, televisions and appliances all saw higher discounts as well, while the average discount for toys decreased, from 34% in 2022 to 27% in 2023.

    Paid search drives 27% of online sales during Cyber Week

    Paid search remains the top marketing channel for Cyber Week, driving 27% of online sales from Thanksgiving through to Cyber Monday.

    However, this number is down slightly from 28% on 2022.

    Direct is the #2 channel, with 21% share of sales. Organic search, email and affiliate are all fairly evenly distributed, while social media drives less than 5% of all Cyber Week sales.

    Black Friday Trends: Three Predictions for the Future of Black Friday

    The Black Friday figures above paint interesting reading on the current state of Black Friday, Cyber Monday and the overall Thanksgiving sales period.

    But how about the future of BFCM? What do these stats tell us about what Black Friday-Cyber Monday will look like next year, five years, ten years from now?

    Here are three predictions for how Black Friday will evolve in the coming years.

    • More sales on mobile: mobile commerce is growing at a fast rate, driving the majority of sales in the US, and 70% of all online sales worldwide. With mobile shopping experiences getting better every year, expect this trend to continue.
    • More early sales: we’ve seen that almost half of all shoppers already take advantage of pre-Thanksgiving sales. With the intense competition and ad costs during Cyber Week, look for more brands to run early promotions, potentially starting as soon as the start of November.
    • More brands driving sales through owned channels: paid ads drive more than a quarter of all Cyber Week sales, but the cost of this keeps going up. Expect to see smart brands utilize “owned” channels, where they can drive sales more or less for free – such as email, SMS and push notifications via their mobile apps.

    If you’re running an ecommerce store, and you don’t have an app, you’re missing out. Our ecommerce App Revenue Calculator shows just how much your brand can gain from launching your own app.

    Sources

    The data in this post was sourced from recent Black Friday-Cyber Monday/holiday spending reports from eMarketer Insider Intelligence, the National Retail Federation, Adobe Analytics, Salesforce, and Drive Research.

  • The World’s Most Online Shopping-Obsessed Nations Revealed

    The World’s Most Online Shopping-Obsessed Nations Revealed

    Buying things online has become second nature for billions of people worldwide. From daily essentials to luxury goods, ecommerce is now woven into everyday life — and in some countries, it’s practically the default way to shop.

    But which nations are taking this digital shift the furthest? Where are people spending the most, shopping the most often, and relying most heavily on ecommerce over traditional retail?

    That question inspired our new global study, which ranks 52 countries by their Online Shopping Obsession Score — a combined measure of annual online spending per shopper, the share of consumer goods purchased online, and the percentage of people who shop online.

    The results reveal fascinating regional patterns — with the United States emerging as the most online shopping-obsessed nation in the world, and the United Kingdom leading Europe.

    Key Takeaways:

    • The United States ranks first globally with a perfect Online Shopping Obsession Score of 100, spending an average of $3,950 per shopper annually.
    • The UK ranks second worldwide and first in Europe, with a score of 71.57 and average annual spending of $2,530.
    • European nations dominate the top 20, claiming 14 of the highest-ranking positions.

    Across the top 10, online shopping now accounts for an average of more than 20% of all consumer purchases.

    The Top 20 Most Online Shopping-Obsessed Countries

    Rank Country Online Spend (%) Annual Spend (USD) Shopper Rate (%) Score (/100)
    1 United States 33.70 $3,950 91.7 100
    2 United Kingdom 23.20 $2,530 84.3 71.57
    3 Netherlands 20.90 $2,620 84.7 69.74
    4 China 31.20 $961 86.3 67.65
    5 Canada 17.90 $2,200 82.6 61.49
    6 Japan 16.20 $2,090 80.4 57.63
    7 Norway 14.50 $1,970 89.4 57.63
    8 Sweden 14.00 $1,820 87.3 54.90
    9 Denmark 13.30 $1,880 84.9 53.75
    10 Switzerland 11.30 $2,100 84.7 53.26
    11 Germany 14.60 $1,840 77.9 52.51
    12 Finland 12.80 $1,630 85.7 51.14
    13 Austria 12.90 $2,080 72.3 50.66
    14 Australia 13.80 $1,710 78.5 50.55
    15 Ireland 14.00 $1,720 74.9 49.62
    16 France 13.40 $1,710 72.9 48.09
    17 Italy 14.90 $2,340 50.9 47.95
    18 Singapore 12.20 $1,210 83.1 45.64
    19 Spain 13.40 $1,140 74.5 43.43
    20 New Zealand 9.10 $1,650 73.9 42.65

    Founder’s take:

    The powerful growth of ecommerce is tightly linked to the dominance of the mobile web.

    Mobile accounts for 62.5% of all internet traffic worldwide, while mobile commerce drives approximately 60% of all global ecommerce traffic.

    With every individual having a direct line to any brand or retailer, in their pockets and at their fingertips, ecommerce has become easily the most convenient way to make a purchase.

    For retailers, understanding this shift in behavior is crucial.

    “With mobile commerce now driving most online sales, retailers need to meet customers where they are: on their phones. Every ecommerce business should be thinking mobile-first, not just in website design but across the entire customer journey. The brands getting it right are those creating faster, more personal experiences that reflect how people actually shop today.”
    – Pietro Saccomani, Founder & CEO, Vendrux.

    Europe’s Online Shopping Leaders

    Europe is home to 14 of the world’s top 20 most online shopping-obsessed nations, highlighting the continent’s advanced ecommerce infrastructure and consumer adoption.

    Top 20 Most Online Shopping-Obsessed Countries in Europe

    Rank Country Online Spend (%) Annual Spend (EUR) Shopper Rate (%) Score (/100)
    1 United Kingdom 23.20 €2,275 84.30 71.57
    2 Netherlands 20.90 €2,356 84.70 69.74
    3 Norway 14.50 €1,771 89.40 57.63
    4 Sweden 14.00 €1,636 87.30 54.90
    5 Denmark 13.30 €1,690 84.90 53.75
    6 Switzerland 11.30 €1,888 84.70 53.26
    7 Germany 14.60 €1,654 77.90 52.51
    8 Finland 12.80 €1,466 85.70 51.14
    9 Austria 12.90 €1,870 72.30 50.66
    10 Ireland 14.00 €1,546 74.90 49.62
    11 France 13.40 €1,537 72.90 48.09
    12 Italy 14.90 €2,104 50.90 47.95
    13 Spain 13.40 €1,025 74.50 43.43
    14 Belgium 8.70 €953 86.40 41.16
    15 Czechia 12.70 €896 71.10 40.07
    16 Poland 13.30 €1,412 43.00 36.16
    17 Portugal 7.30 €1,034 53.90 28.83
    18 Türkiye 9.00 €877 41.70 25.01
    19 Greece 6.00 €722 55.00 24.45
    20 Croatia 5.90 €693 52.50 23.15

    Regional Insights

    • Nordic Excellence: Norway leads Europe in online shopping penetration at 89.4%, followed by Sweden, Denmark and Finland — all in the continent’s top ten.
    • Western European Dominance: The UK and Netherlands are clear leaders in both spending and digital adoption, underlining their advanced ecommerce ecosystems.
    • Southern Gap: Italy and Spain remain outside the top ten, reflecting slower digital penetration despite high per-shopper spending.
    • Eastern Growth: Czechia and Poland are emerging as strong performers, driven by rapid digital adoption and growing trust in online transactions.
    • The Germany Paradox: Despite its economic strength, Germany ranks only seventh in Europe, with lower per-capita online spending than smaller markets such as the Netherlands and the UK.

    Founder’s take:

    While ecommerce is a key driver in markets like the US, UK, China and Japan, when we zoom out, we find major room for growth in emerging markets.

    These are the markets where the infrastructure may not be there just yet, where shipping is not as fast and easy, where not so many major brands are readily available.

    The interesting part is that emerging markets are often more mobile-centric; indicating that once the infrastructure catches up, we may see a sharp spike in ecommerce (and, in particular, mobile commerce).

    “Europe’s online shopping data highlights clear divides between the continent’s digital leaders and emerging markets. While Northern and Western Europe are now fully digital-first, Southern and Eastern regions are moving quickly to close the gap, driven by improved infrastructure and growing consumer confidence in online purchasing.”
    – Pietro Saccomani, Founder & CEO, Vendrux.

    Final Thoughts

    The online shopping revolution isn’t coming; it’s already here.

    The United States is leading the way in online shopping obsession, fast approaching the point where online may eclipse in-store as the most common way people buy things.

    Even traditional in-store dominant verticals, like grocery stores, are starting to go more online, with apps like Instacart making it more convenient to order weekly staples from your phone, saving the trip down to your local store.

    And yet, as our European data shows, the global market still has room to grow. Expect this trend to continue, and more consumers all over the world to become digital natives throughout the rest of the decade.

    Methodology

    This study identified the world’s most online shopping-obsessed countries by analyzing three key ecommerce metrics.

    We examined online share of consumer goods spend (labeled as “Online Spend on Consumer Goods”), average revenue per user or ARPU (labeled as “Annual Spend Per Shopper”), and user penetration rate (labeled as “Online Shopper Rate”). Data was sourced from Data Reportal’s Digital 2025 Global Overview Report and Statista’s eCommerce Market Insights (2025).

    Online Spend on Consumer Goods measures the proportion of purchases made online versus in stores. Annual Spend Per Shopper captures individual yearly spending in USD. Online Shopper Rate shows the percentage of the population who shop online. Annual Spend Per Shopper has been converted from USD to EUR using the European Central Bank annual average exchange rate from October 30, 2024 to October 30, 2025 (1 EUR = 1.1122 USD).

    Each metric was normalized to a 0-100 scale, then combined using weighted averaging: Online Spend on Consumer Goods (40%), Annual Spend Per Shopper (35%), and Online Shopper Rate (25%).

  • The Mobile App Impact on BFCM 2025: Key Stats & Trends

    The Mobile App Impact on BFCM 2025: Key Stats & Trends

    Black Friday/Cyber Monday is evolving.

    It’s no longer a short sprint lasting a few days. And it’s getting harder to drive consistent returns from traditional engagement and retention channels.

    What hasn’t changed is its importance. BFCM is still one of the most important blocks on the ecommerce calendar, with the potential to generate momentum brands can carry into the new year.

    This BFCM, we analyzed results from 100+ shopping apps, including Vendrux customers and other popular DTC apps, to understand how brands approached Black Friday; particularly through mobile apps, one of the most underutilized yet consistently overperforming ecommerce channels.

    A few patterns stand out:

    • The BFCM window is stretching longer
    • Push notifications are emerging as a secret weapon for busy promo events
    • Apps move the needle in real way, for a number of key revenue metrics

    Let’s dive deeper now. Here’s what we learned:

    The BFCM Promo Window

    We studied 87 popular shopping apps over the BFCM period, primarily independent DTC brands across categories including fashion, beauty, home & kitchen, food & beverage, supplements, and luxury.

    The first notable takeaway was that 75% of brands (65 of 87) were running BFCM promos in full-swing on Monday the 24th (the Monday prior to Black Friday).

    Black Friday/Cyber Monday is no longer Friday-Monday. The window is stretching, with brands looking to gain visibility when there’s less competition for attention.

    Opting out of BFCM?

    By Cyber Monday (December 1), 93% of brands (81 of 87) were running a BFCM promotion in their app.

    Two things stand out:

    • The share of brands running early BFCM promotions is even higher when excluding those that skipped the period entirely.
    • It suggests that a small but notable group (just under 10%) appeared to opt out of BFCM in their app altogether.

    In several cases, brands ran BFCM promotions on their website but not in their app.

    That usually points to one of two issues:

    • The app was deliberately excluded from the promotion
    • The app experience is out of sync with the website, often due to neglect

    Either way, the takeaway is the same: many brands still aren’t fully utilizing their apps during the most important sales period of the year.

    And as a channel, there’s still a lot of untapped potential.

    Push Notifications: the Secret Growth Lever

    How many emails and promotional SMS did you get this Black Friday?

    Answer: a lot.

    Brands with mobile apps have access to a different channel – less saturated and often more effective during high-intent moments: push notifications.

    Less than 5% of successful ecommerce brands have their own apps. And among those brands, many still aren’t sending push notifications frequently.

    This matters because the ROI on push notifications is incredible.

    • Zero cost to send
    • Near guaranteed visibility (shows up on the customer’s lock screen)
    • Minimal friction to purchase (one tap brings the customer straight into the app)

    We wanted to see how brands were using push over the BFCM period; how many brands are using push, what they’re sending, and how the frequency differs from a normal period.

    That’s why I personally sacrificed my lock screen for two weeks, receiving over 1,000 push notifications, and collating the results.

    What we saw in the data

    During the core BFCM week (Nov 24-30):

    • 8 brands sent an average of 2 or more push notifications per day
    • 6 brands sent 20+ notifications across the week
    • The most aggressive sender pushed 44 notifications in one week
    • The average brand sent 8.6 notifications that week
    • The median was 7 notifications, compared to a typical baseline of ~3-5 per week

    After Cyber Monday (Dec 1-7):

    • Only 5 brands maintained an average of 2+ pushes per day
    • Just 3 brands sent 20+ notifications
    • The top sender dropped from 44 the previous week to 35
    • Average volume fell to 7.15 notifications
    • Median dropped to 5.5, only slightly above normal levels

    Crucially, nearly 20 brands weren’t sending push notifications at all during BFCM.

    That’s a major growth lever, and as many Vendrux customers have told us, the number one reason to launch an app, not being used.

    The biggest missed opportunity

    The bigger miss is not the brands who aren’t using push at all. It’s those who are, but don’t have one core flow set up.

    Only 26 of the brands we studied were sending abandoned cart notifications.

    Abandoned cart notifications automatically follow up with app shoppers who leave an item in their cart, unpurchased.

    They get a notification right on their lock screen, and one tap brings them back into the app to finish their purchase.

    This automated sequence takes very little work (zero, after the initial setup), and recovers would-be lost revenue on autopilot.

    We’ve seen brands recover over $200,000 in revenue in just 30 days with abandoned cart notifications.

    And the impact could be even bigger over BFCM, with more distractions, more chances for the shopper to get pulled away.

    We saw this clearly in the data:

    • One beauty brand saw a 152% increase in abandoned cart push revenue, while total store revenue rose just 29%. Cart recovery accounted for 83% of their total push revenue.
    • One wellness brand recovered over $30,000 from abandoned cart push during BFCM alone; roughly 20% of their total app revenue.

    Given the ease of setup and upside, abandoned cart push should be a baseline requirement for any brand running an app, especially during peak traffic periods.

    How Mobile Apps Drove Revenue During BFCM

    Numerous Vendrux merchants drove hundreds of thousands in revenue through their apps over the two week extended BFCM period.

    We saw consistent lifts across key revenue metrics, from revenue contribution to AOV, conversion rate, and revenue per user.

    Here are the highlights.

    Higher Revenue & Revenue Contribution

    We’re seeing a meaningful share of brands’ overall revenue come through their app during the BFCM period. 

    In many cases, app revenue grew faster than mobile and overall revenue, showing their promotions are having a stronger impact from their app cohort.

    • A fashion brand saw app revenue contribution (percentage of total revenue from their app) increase by 18% compared to the previous period.
    • A fashion brand saw app revenue increase by 42% versus the previous period.
    • A beauty and fragrance brand saw app revenue increase by 125% (compared to an 81% rise in total mobile revenue).
    • A fashion/maternity brand saw app revenue increase by 337% and app transactions increase by 233%.
    • A luxury fashion brand saw app revenue increase by 95%, compared to a 44% increase across mobile overall.
    • A home decor brand saw app revenue increase by 69% compared to the previous period.

    Higher Average Order Value (AOV)

    Apps consistently drive larger baskets, not by a few percentage points, but often by 25-100%+, especially in higher-consideration purchases.

    This pattern appeared consistently across fashion, beauty, home, and specialty retail.

    • A fashion brand saw app AOV of $116.52 compared to $92.85 on mobile web (a 25.5% increase).
    • A luxury fashion brand saw app AOV of $533.31 compared to $397.05 on mobile web (+34.3%).
    • A beauty and professional supplies brand saw app AOV of $309.48 compared to $144.61 on mobile web (+114%).
    • A home decor brand saw app AOV of $94.70 compared to $73.84 on mobile web (+28.3%).

    Higher Revenue Per User

    Across categories, apps consistently generated significantly more revenue per user than mobile web during BFCM. In many cases, multiple times higher.

    • A fashion brand saw app revenue per user of $19.51 compared to $7.11 on mobile web (a 174.4% increase).
    • A luxury fashion brand saw app revenue per user of $42.41 compared to $5.41 on mobile web (nearly 7x higher).
    • A beauty brand saw app revenue per user of $11.16 compared to $3.08 on mobile web (a 262.3% increase).
    • A pet supplies brand saw app revenue per user of $7.92 compared to $2.55 on mobile web (a 210.6% increase).

    Higher Conversion Rates

    Apps also consistently delivered meaningfully higher conversion rates than mobile web during BFCM.

    • A fashion brand saw app conversion rate of 5.31% compared to 2.96% on mobile web (a 79.4% increase, or nearly 1.8x higher).
    • A food and beverage brand saw app conversion rate of 5.76% compared to 2.77% on mobile web (a 107.9% increase).
    • A pet supplies brand saw app conversion rate of 6.41% compared to 2.16% on mobile web (a 196.8% increase, or almost 3x higher).
    • A beauty brand saw app conversion rate of 12.63% compared to 5.92% on mobile web (a 113.3% increase).

    It’s worth noting that these apps largely mirror the brands’ websites. There’s no major redesign or feature overhaul.

    Yet even small improvements, combined with the self-contained nature of an app, were enough to drive 2-3x higher conversion rates during BFCM.

    Push Notification Revenue

    Several brands saw large increases in push-attributed revenue, including notable contributions from cart abandonment campaigns.

    • A fashion brand saw push-driven revenue increase by 152% compared to the previous period.
    • A beauty and fragrance brand saw push revenue increase by 174%.
    • A pet supplies brand saw push revenue increase by 260%.
    • A wellness brand generated over $30,000 from cart abandonment push notifications, representing roughly 22% of total app revenue.

    App User Growth & Engagement

    In addition to revenue metrics, brands also saw growth in app usage and engagement. This included increases in new app users as well as longer session durations compared to mobile web.

    • A fashion brand saw new app users increase by 168% over the period.
    • A fashion brand saw new app users increase by 85% compared to the previous period.
    • A luxury fashion brand saw average app session duration of 5 minutes 45 seconds versus 2 minutes 55 seconds on mobile web.

    Overall BFCM performance summary: apps vs mobile web

    Here’s an overall look at how our brands achieved better results during the promotional period (measured from Nov 23 – Dec 5).

    • 25-35% higher average order value (AOV) from app users, with some categories seeing lifts of 100%+.
    • 2-7x higher revenue per user.
    • 80-115% higher conversion rates vs mobile web (in several cases 2-3x higher).
    • App session duration often 60–100% longer.
    • Many brands seeing 150-260% push revenue growth, while new app user growth ranged from 15-85%.

    Key Takeaways for Ecommerce Brands

    BFCM is still the most important few days on the calendar for any ecommerce brand.

    There’s more traffic, stronger intent, and excitement that can be weaponized to drive major revenue.

    But the period is getting longer. Competition is getting stronger. It’s becoming harder to stand out, and there’s a bigger swing from brands that do BFCM right, and those who miss the mark.

    At a time when attention is more abundant, but also harder to secure, having a mobile app gives you a powerful leg up.

    You get a more direct connection with your best customers; a shopping experience that’s your brand, and nothing else; and push notifications, still the most underutilized channel in ecommerce.

    BFCM 2025 has just finished, but you can (and should) start planning already for BFCM 2026.

    That means, if you haven’t already, launching your own mobile app. Vendrux is the most straightforward way to do it. No rebuilding, no templates, no duplicate work to keep your website and mobile app in sync.

    If you want to see what your app could look like, get a free preview now – or book a free consultation to talk it over.