Category: Ecommerce

  • WooCommerce vs Shopify: Market Share Insights for 2026

    WooCommerce vs Shopify: Market Share Insights for 2026

    If you’re choosing between WooCommerce and Shopify, you’re looking at the two biggest ecommerce platforms in the world. Between them, they power the majority of online stores.

    But how do they actually stack up in terms of market share, store count, and growth? Here’s a comprehensive breakdown of the latest data – updated for 2026.

    Want weekly insights into how 7, 8 and 9-figure brands are driving sustainable growth? That’s what you get with our value-packed newsletter, The Retention Edge. Subscribe for free today.

    Key Takeaways

    • Shopify holds 26.2% ecommerce platform market share, powering approximately 4.8–6.5 million active stores worldwide.
    • WooCommerce holds between 20-33% market share (depending on methodology), with over 4.5 million active stores tracked by StoreLeads.
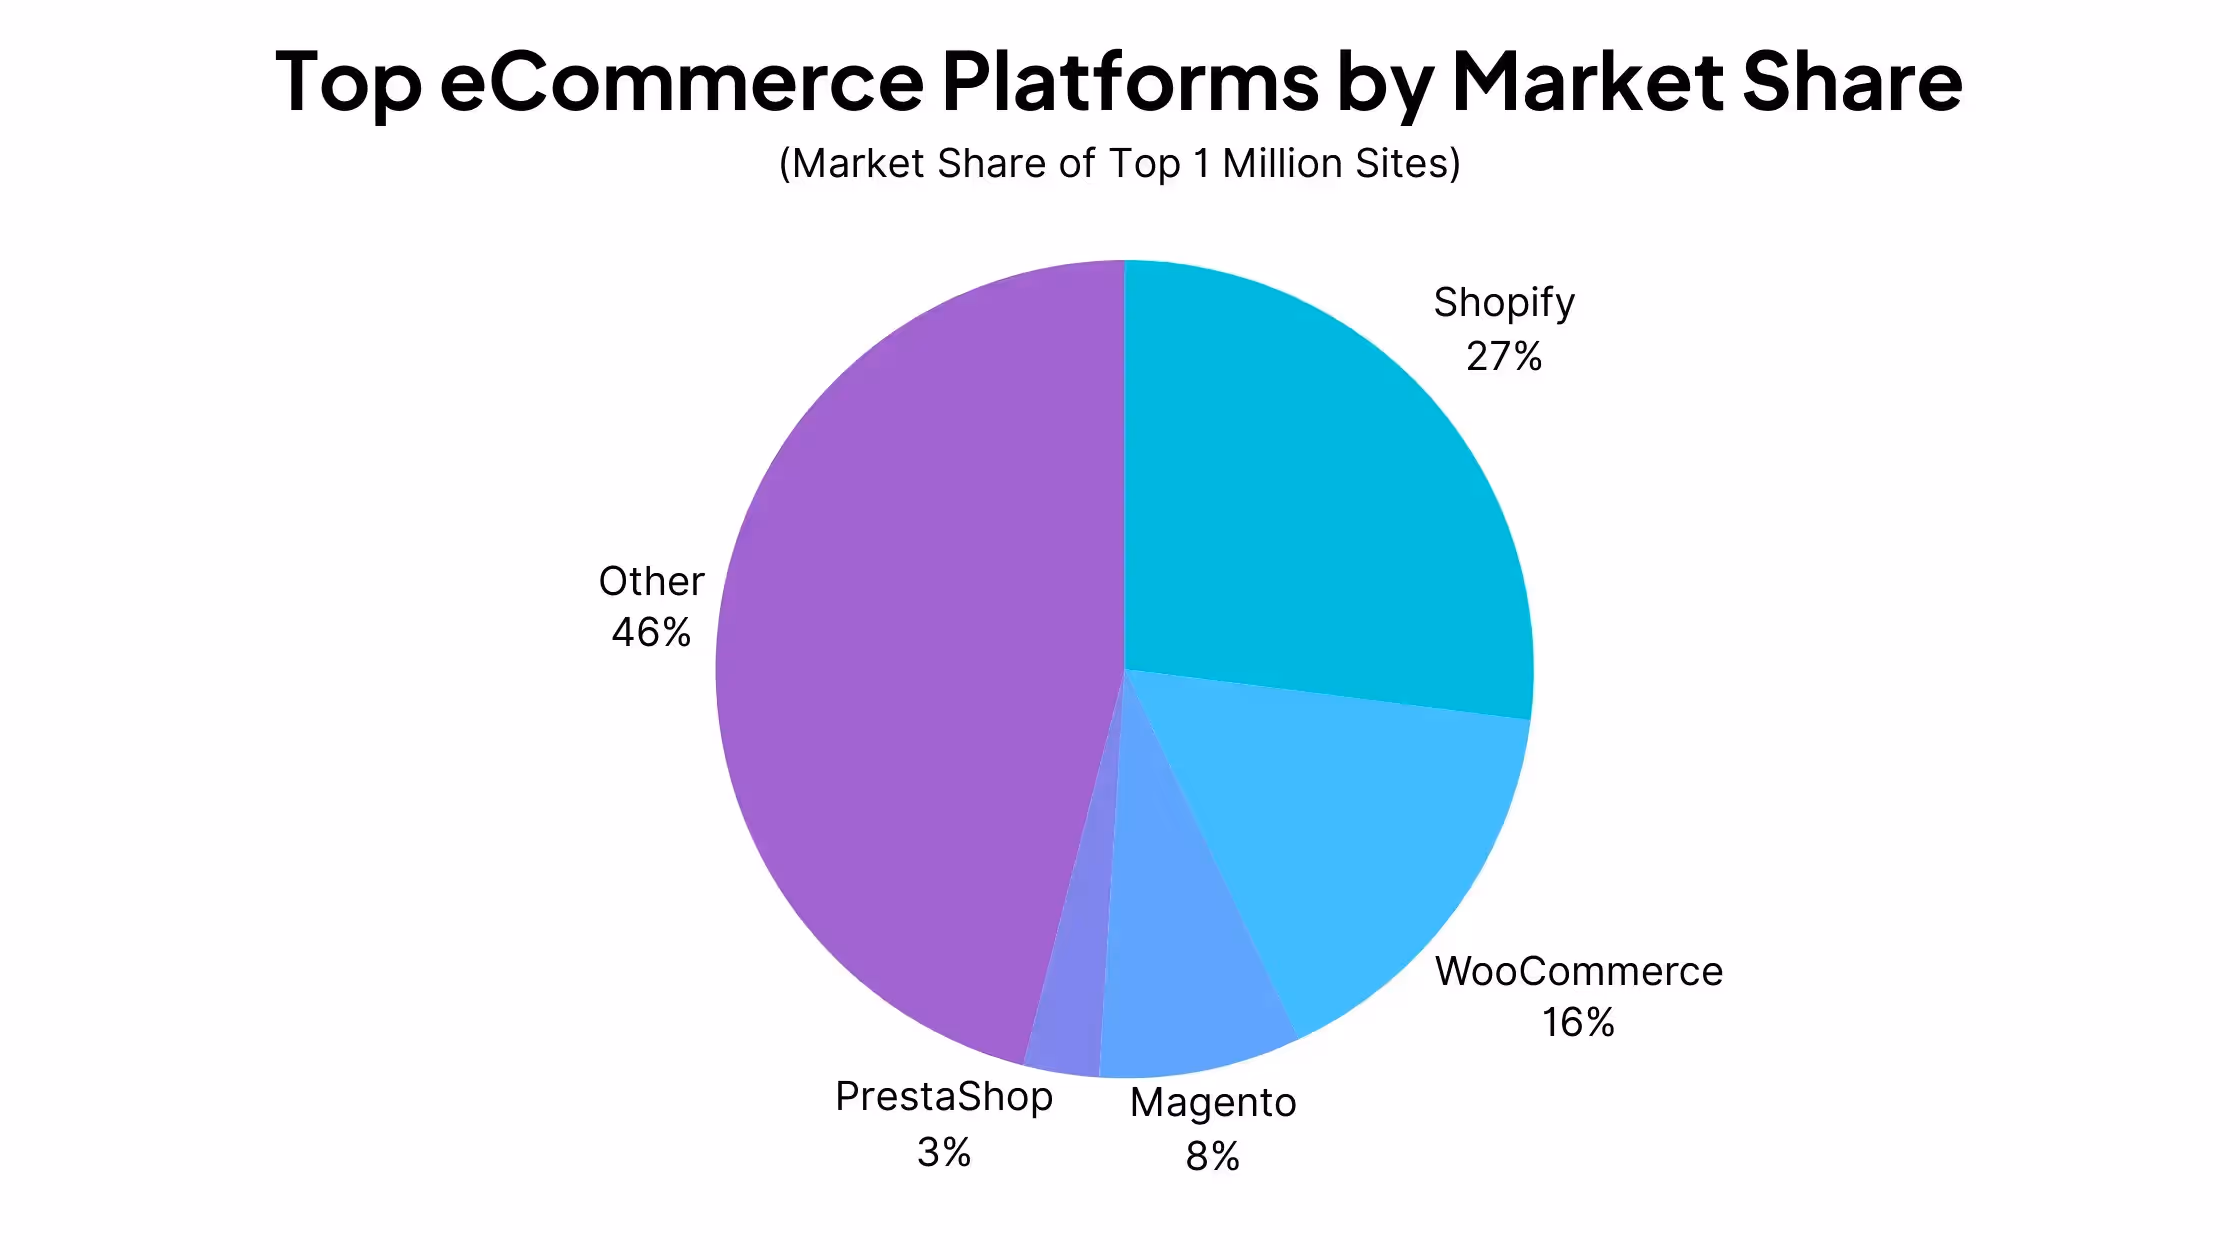
    • Among high-traffic sites, Shopify leads with 28.8% of the top 1 million ecommerce websites, compared to WooCommerce’s 18.2%.
    • Shopify’s GMV reached $292 billion in 2024 and is on pace to exceed $350 billion in 2025.
    • WooCommerce’s estimated GMV is $30–35 billion annually – much smaller in transaction volume, but spread across more stores.
    • Together, they power over half of all ecommerce websites on the internet.

    A Note on Market Share Numbers

    Before diving in, it’s worth understanding why you’ll see different numbers depending on where you look.

    We’ve used publicly available data from a few different places – BuiltWith, StoreLeads and W3Techs.

    Market share figures for ecommerce platforms vary significantly based on how they’re measured:

    • BuiltWith scans websites for specific technologies. It tracks checkout implementations and platform fingerprints.
    • StoreLeads tracks active online stores across platforms using a broader detection methodology.
    • W3Techs measures CMS usage across the entire web, not just ecommerce sites.

    These different approaches produce different results. For example, WooCommerce can show up at 20% in one dataset and 33% in another – both can be accurate within their own methodology. We’ll cite the source for each figure so you can evaluate them in context.

    WooCommerce Market Share

    WooCommerce commands a significant share of the ecommerce market, though the exact figure depends on how you measure it:

    • 20.1% of all ecommerce websites (BuiltWith, 2025)
    • 33.4% of ecommerce stores tracked globally (StoreLeads, August 2025 – 4.53 million out of 13.6 million stores)
    • 18.2% among the top 1 million ecommerce sites (BuiltWith, 2025)

    The gap between these numbers comes down to what counts as a “WooCommerce site.” Over 6.5 million websites have WooCommerce elements installed, but not all of them are active stores running WooCommerce checkout. The 4.53 million figure from StoreLeads represents active stores more specifically.

    About WooCommerce

    WooCommerce isn’t a standalone platform. It’s a plugin for WordPress, which powers roughly 43% of all websites on the internet (about 518 million sites, according to W3Techs). Over 10% of WordPress installations include WooCommerce.

    That relationship with WordPress is a big deal. It means WooCommerce benefits from the largest CMS ecosystem in the world: tens of thousands of themes, plugins, and developer resources. 

    It also means WooCommerce stores can be anything from a small side project to a large-scale operation, which partly explains why it shows such high total store counts but lower representation among top-traffic sites.

    Key WooCommerce Statistics (2025–2026)

    Metric Figure
    Ecommerce platform market share (BuiltWith) 20.1%
    Ecommerce store share (StoreLeads) 33.4%
    Share among top 1M ecommerce sites 18.2%
    Active stores (StoreLeads) 4.53 million
    Websites with WooCommerce elements 6.5+ million
    Cumulative plugin downloads 211+ million
    Average daily downloads ~30,000
    Annual store count growth ~6%
    Estimated annual GMV $30–35 billion
    Available languages 66
    WordPress themes compatible 1,500+
    WooCommerce plugins (WordPress directory) 6,000+
    WooCommerce extensions (official store) 700+ free and paid
    GitHub contributors 1,100+
    Cost Free (open source)

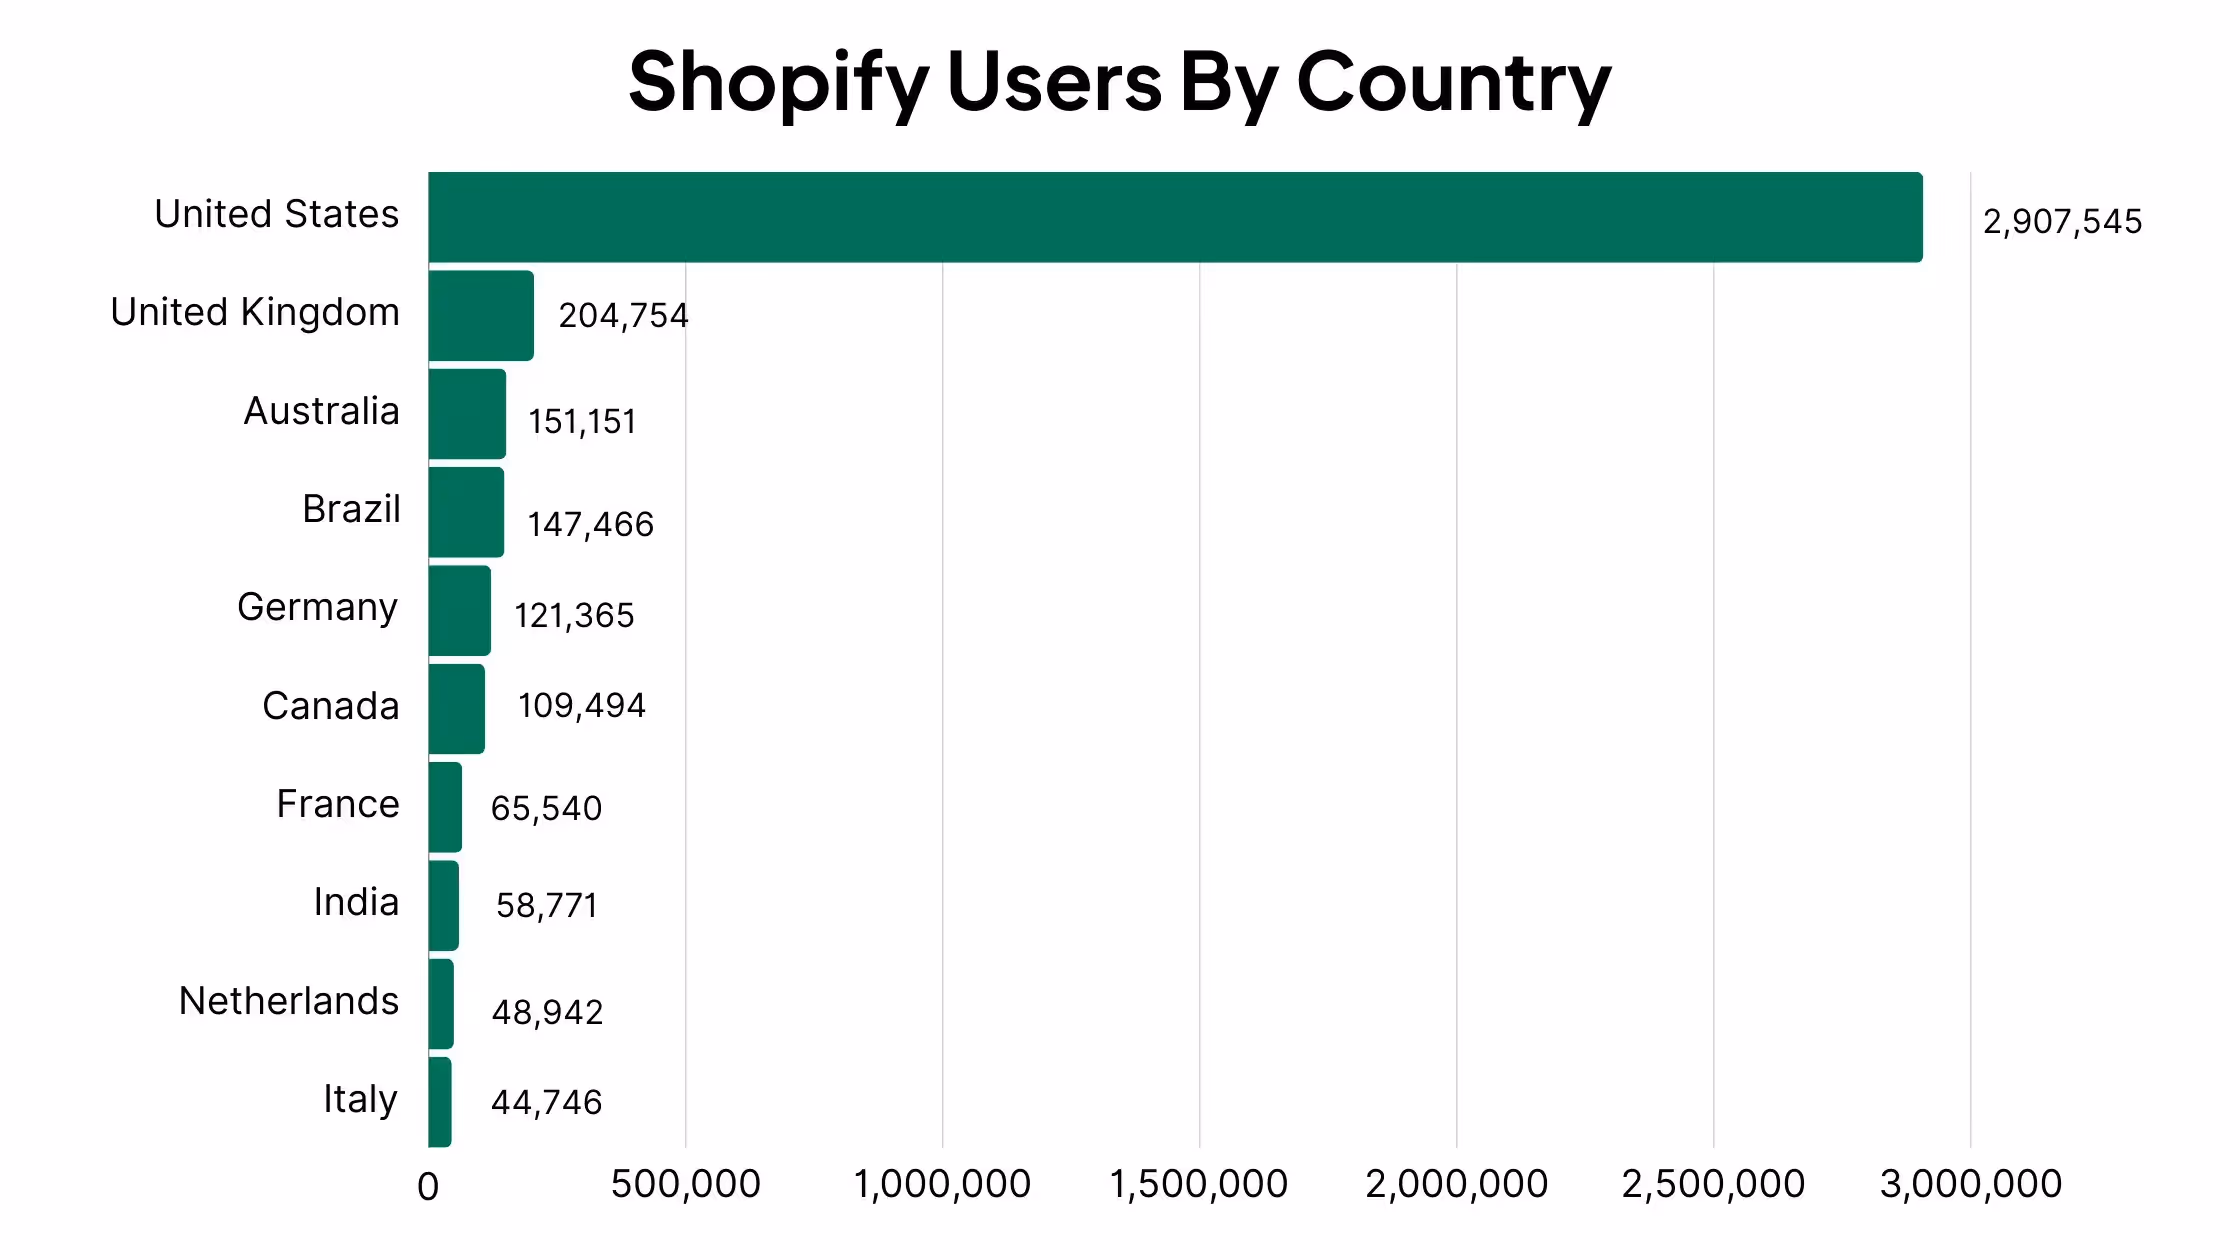
    WooCommerce Regional Breakdown

    WooCommerce has a genuinely global footprint:

    • United States: ~245,000 sites
    • United Kingdom: ~24,000 sites
    • India: ~15,000 sites
    • Strong adoption across Europe (25–30% regional share) and emerging markets where cost sensitivity makes the free, open-source model attractive.

    Shopify Market Share

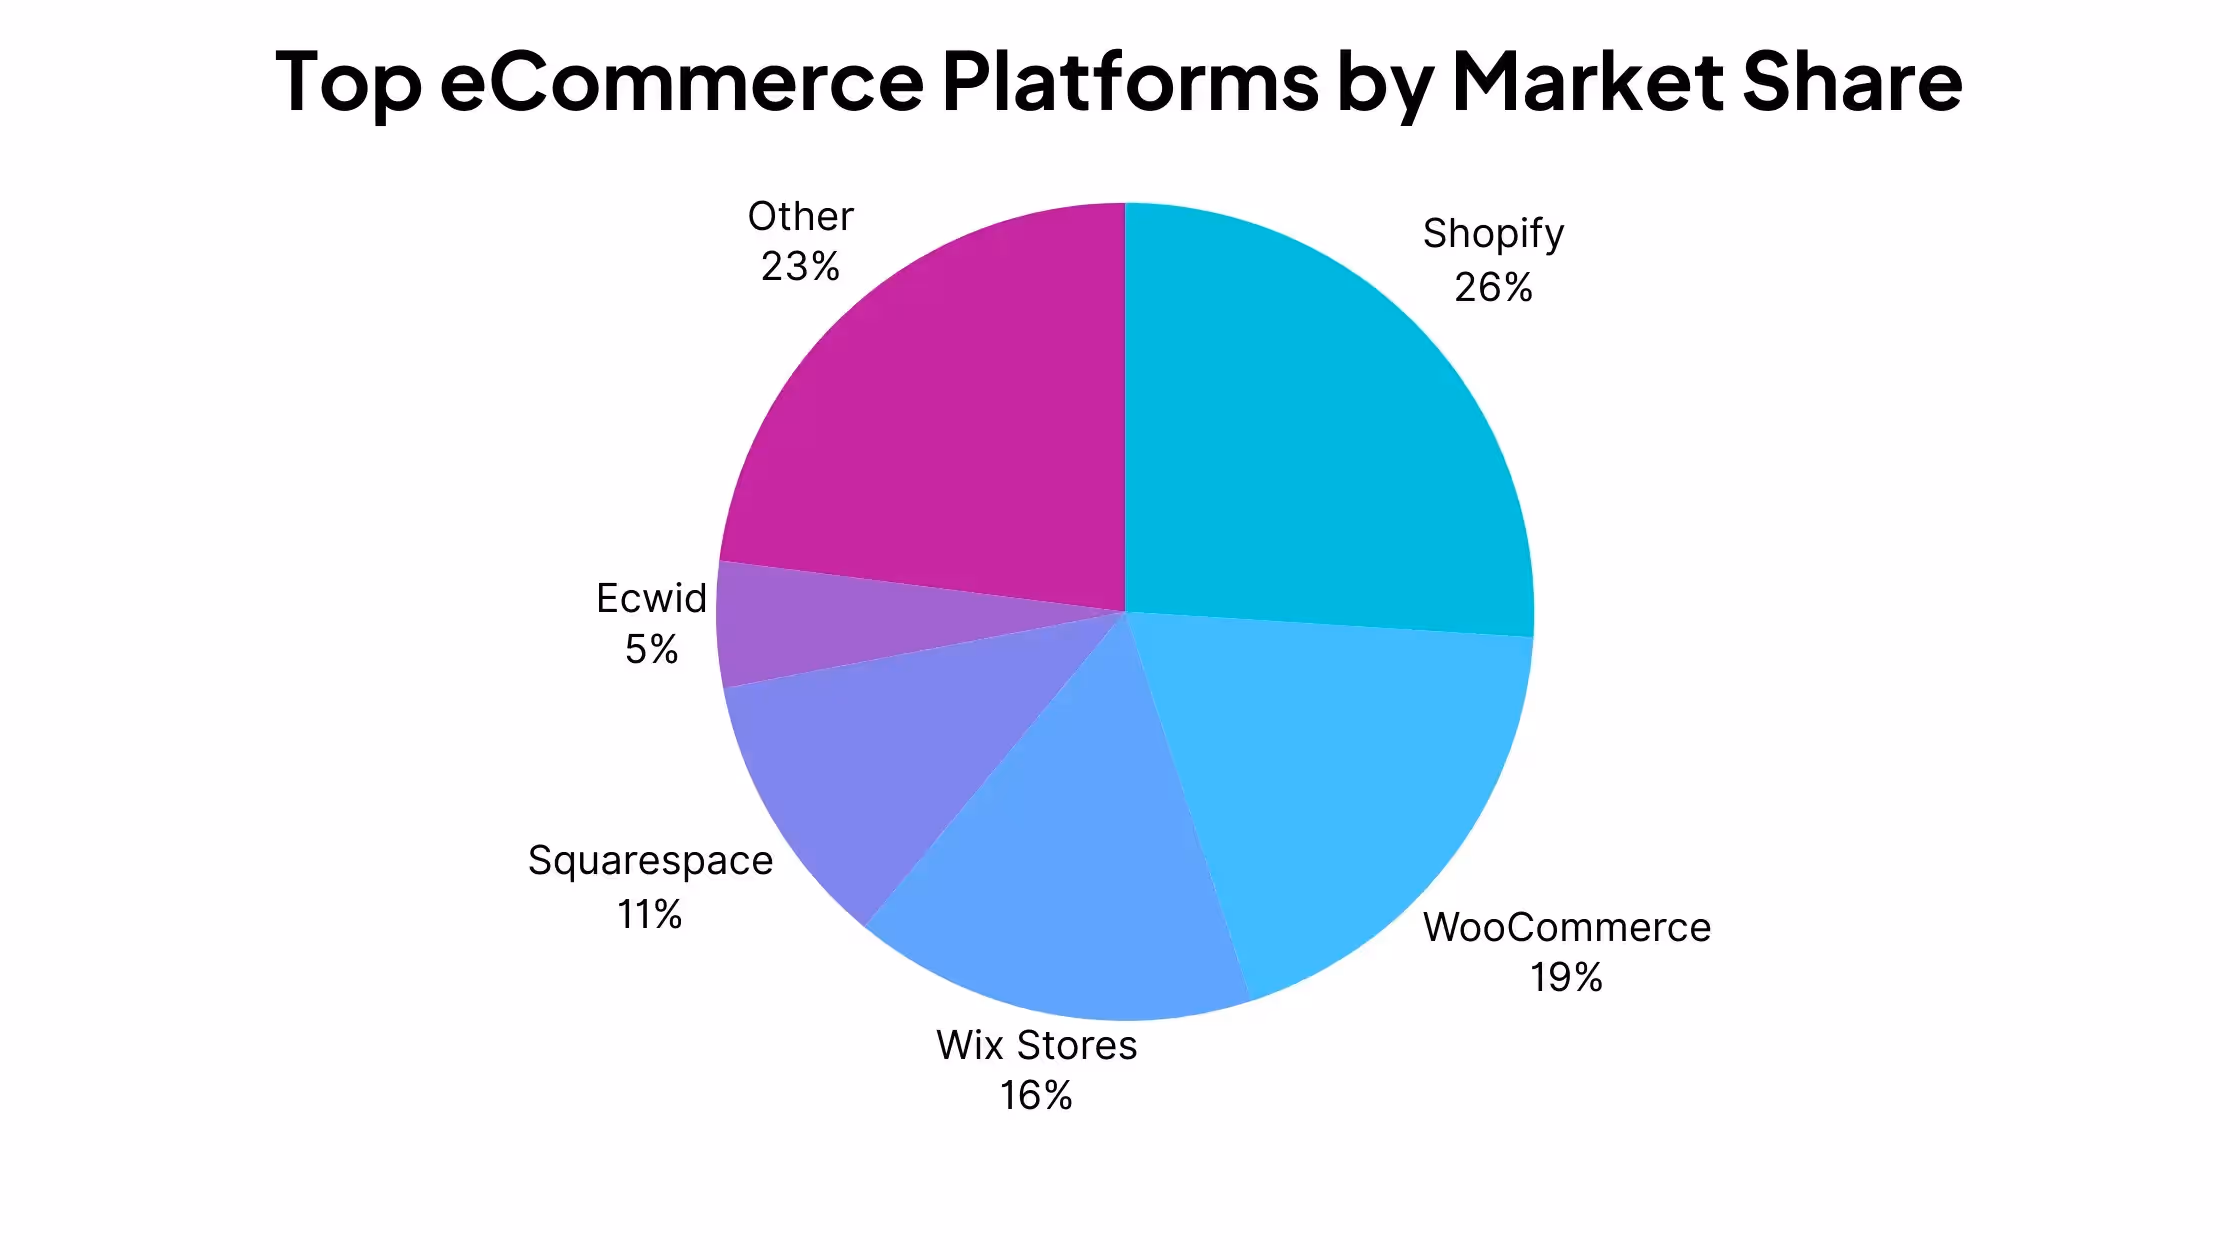
    Shopify leads the ecommerce platform space by most measures:

    • 26.2% of all ecommerce websites (BuiltWith, 2025)
    • 28.8% among the top 1 million ecommerce sites (BuiltWith, 2025)
    • 10.32% of the global ecommerce platform market more broadly (Statista, 2025)
    • ~29–30% of the US ecommerce software market — the clear domestic leader

    That last point is important. Among high-traffic, high-revenue stores, Shopify punches well above its weight. 

    The platform dominates in the top 10K, top 100K, and top 1 million site categories, which suggests it’s the platform of choice for established, growing brands.

    About Shopify

    Unlike WooCommerce, Shopify is a standalone, hosted platform. You don’t need WordPress or any other CMS – it’s a self-contained system for building and running an online store.

    Shopify also operates as a CMS, holding 6.2% of the total CMS market (second only to WordPress). But its core strength is ecommerce, and that’s where it focuses nearly all of its development effort and resources.

    Key Shopify Statistics (2025–2026)

    Metric Figure
    Ecommerce platform market share 26.2%
    Share among top 1M ecommerce sites 28.8%
    US ecommerce software market share ~29%
    Active stores worldwide 4.8–6.5 million
    US-based stores ~3–3.5 million
    UK stores ~241,000
    Countries served 175+
    2024 annual GMV $292 billion
    2024 annual revenue $8.88 billion
    Cumulative GMV (all time) $1 trillion+
    2024 Black Friday / Cyber Monday sales $11.5 billion
    Shoppers who bought from Shopify merchants (2024) 875 million+
    Average store conversion rate 1.4%
    Top 10% store conversion rate 4.7%
    Apps on Shopify App Store 13,000+
    Shopify Plus stores ~76,600
    Shopify Plus new launches 300+ per week
    Mobile share of Shopify traffic 68%
    Mobile share of purchases 79%

    Shopify Growth Trajectory

    Shopify’s growth over the last five years has been dramatic:

    Year Approximate Active Stores
    2020 1.7 million
    2021 2.1 million
    2022 2.9 million
    2023 4.4 million
    2024 4.6 million
    2025 4.8–6.5 million

    The COVID-19 pandemic was a major accelerant. Between March 2020 and January 2022, over 2.5 million new Shopify sites went live, a 201% increase.

    Revenue growth has been equally strong. Shopify posted $8.88 billion in revenue for 2024 (up 26% year-over-year), with Q2 and Q3 2025 each showing 30%+ growth. 

    The company is projected to exceed $12 billion in revenue by 2026.

    Shopify’s Enterprise Push

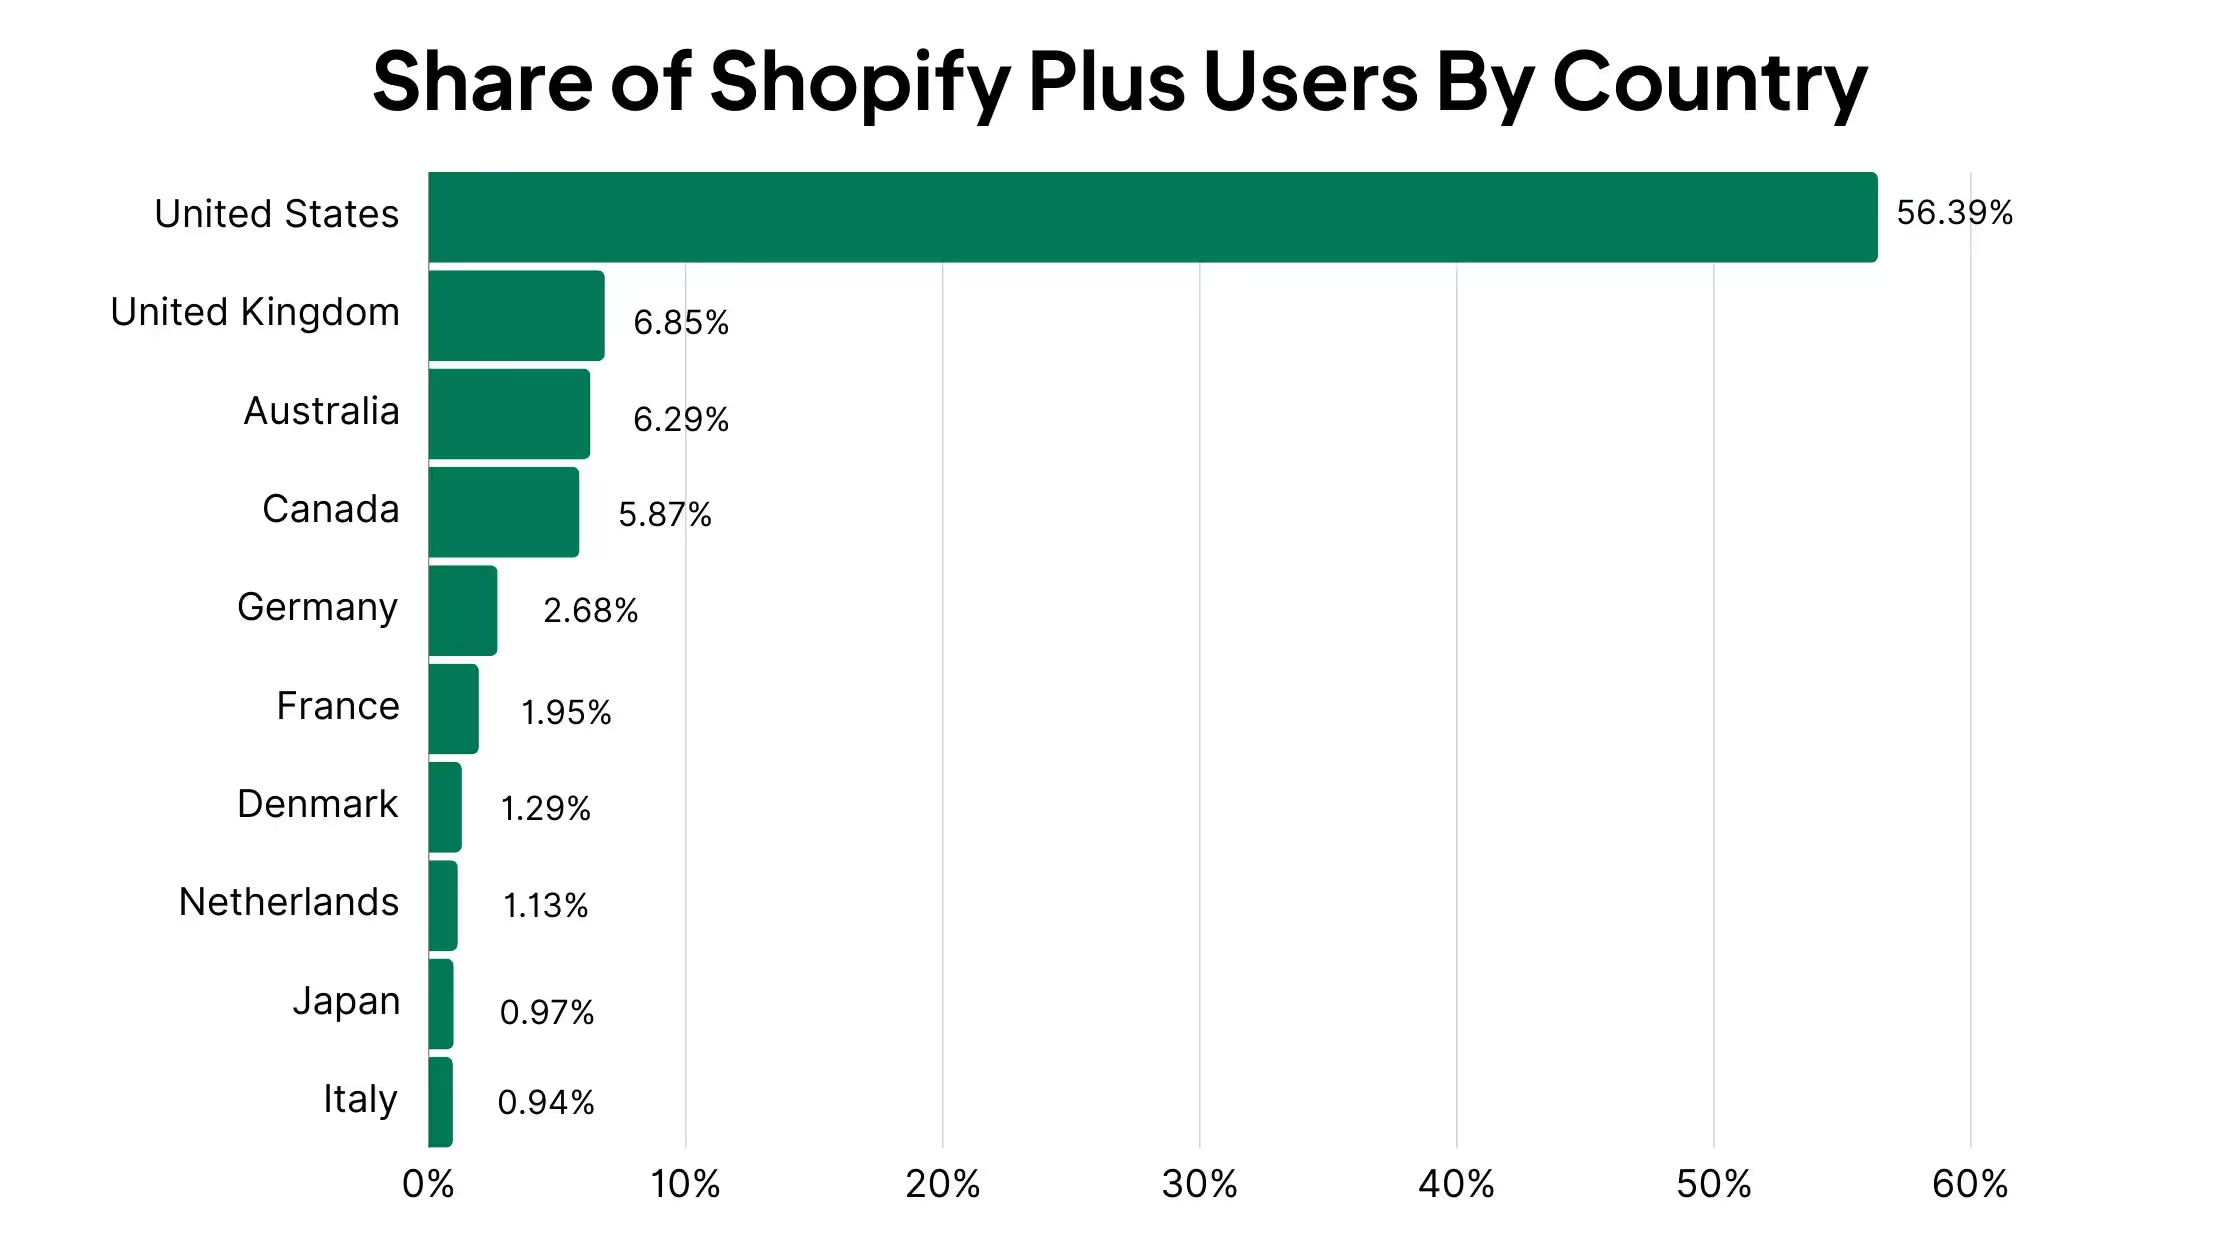
    Shopify Plus (starting at $2,300/month) has become a meaningful part of the business, with roughly 76,600 stores and 300+ new merchants launching weekly. 

    Major brands like Gymshark, Red Bull, Nestlé, Pepsi, Tesla, and LVMH run on Shopify, which contributes to its outsized presence among high-traffic sites.

    WooCommerce vs Shopify: Head-to-Head Comparison

    Category WooCommerce Shopify
    Market share (BuiltWith) 20.1% 26.2%
    Top 1M site share 18.2% 28.8%
    Active stores 4.53M (StoreLeads) 4.8–6.5M
    2024 GMV ~$30–35B (estimated) $292B
    Pricing model Free (open source) Paid subscription
    Hosting Self-hosted (BYO hosting) Fully hosted
    CMS dependency Requires WordPress Standalone
    App / plugin ecosystem 6,000+ plugins + 50,000+ WordPress plugins 13,000+ apps
    Enterprise tier No official tier Shopify Plus ($2,300/mo)
    Primary strength Flexibility, cost, WordPress ecosystem Ease of use, scale, enterprise features

    What the Numbers Tell Us

    The market share data paints a nuanced picture. Here are my top takeaways:

    Shopify dominates among high-traffic, high-revenue stores. Its lead in the top 1 million sites (28.8% vs 18.2%) and its massive GMV ($292 billion vs an estimated $30-35 billion) show that Shopify is where bigger, more established brands tend to land.

    WooCommerce has broader total adoption. When you count all ecommerce sites (not just the biggest ones), WooCommerce’s numbers are comparable or even higher than Shopify’s. The free, open-source model makes it accessible to anyone with a WordPress site.

    They serve different audiences. WooCommerce attracts merchants who want full control, already use WordPress, or are cost-sensitive. Shopify attracts merchants who want a managed, all-in-one platform and are willing to pay for convenience and reliability.

    Neither platform is “winning” in an absolute sense – they’ve carved out different segments of a massive and still-growing market.

    How to Choose the Right Platform

    The right platform depends on your business, not on market share rankings. Here’s a practical framework:

    WooCommerce is typically a better fit if you:

    • Already have a WordPress website
    • Want full control over your hosting, code, and data
    • Are comfortable managing (or hiring someone to manage) updates, security, and performance
    • Are working with a limited budget for platform fees
    • Need deep customization that goes beyond what a hosted platform offers

    Shopify is typically a better fit if you:

    • Want a managed, all-in-one solution that handles hosting, security, and updates
    • Prioritize ease of use and fast setup
    • Are scaling quickly and need enterprise-grade infrastructure
    • Want access to Shopify’s native features (Shop Pay, Shopify Payments, POS)
    • Don’t want to manage the technical side of running an ecommerce site

    Both Platforms Work Well with Mobile Apps

    Regardless of which platform you choose, mobile is a critical channel. 

    68% of Shopify traffic comes from mobile devices, and 79% of purchases happen on mobile – numbers that are broadly consistent across ecommerce.

    Both WooCommerce and Shopify integrate well with mobile app solutions like Vendrux, which lets you extend your existing store into a native iOS and Android app without rebuilding anything. 

    Whether you’re running a WooCommerce store on WordPress or a Shopify storefront, your full website experience, including all your integrations, customizations, and checkout flow, carries over into the app.

    If you’re curious whether a mobile app makes sense for your brand, book a free consultation or get a free app preview to see what your store would look like as a native app.

    Final Thoughts

    The ecommerce platform market continues to grow, and both Shopify and WooCommerce are growing with it. 

    Shopify leads in market share, GMV, and presence among top-tier merchants. WooCommerce holds strong with its WordPress ecosystem, global accessibility, and open-source flexibility.

    The numbers will shift as the market evolves, but the core dynamic is clear: 

    • Shopify is the go-to for merchants who want a managed, scalable platform. 
    • WooCommerce is the go-to for merchants who want control, flexibility, and the WordPress ecosystem.

    Together, they power the majority of ecommerce on the internet. And that’s unlikely to change anytime soon.

    Statistics sourced from BuiltWith, StoreLeads, W3Techs, Statista, Omnisend, Marketplace Pulse, Shopify earnings reports, and Red Stag Fulfillment research. All figures reflect the most recent available data as of early 2026.

  • Why Ecommerce Mobile Apps Fail (And How to Make Yours a Success)

    Why Ecommerce Mobile Apps Fail (And How to Make Yours a Success)

    Many ecommerce brands try launching a mobile app, only to be disappointed with the results. They don’t see a return, adoption stalls, and within months the app is either neglected or written off as a failed experiment.

    This negative sentiment spreads throughout the ecom community… and all of a sudden you get the impression from talking to other brand owners that apps don’t work.

    The truth is: mobile apps can deliver exceptional results. Launching an app could be one of the best things you do for your business. The ROI potential is massive, as much as 53x for some of the brands we’ve worked with.

    But at the same time, there are many “failed” apps out there. And there are very real reasons you could launch an app that doesn’t deliver the kind of results you are looking for.

    Let’s explore the most common reasons ecommerce mobile apps fail, and how each one can be avoided with the right strategy, mindset, and support.

    Vendrux helps you create the perfect, high-ROI mobile app, by converting your existing website. Want to learn how? Start with a free preview of your app now.

    1. No One Knows Your App Exists

    Too often, brands build an app but don’t promote it.

    It’s not mentioned on the website. There’s no email, no SMS announcing the app. No incentive offered to download it. Then they wonder why no one’s using the app, and write it off as a failure.

    Without visibility, even your most loyal customers won’t bother downloading it.

    The fix: Build a real launch plan. Promote your app across every channel – your homepage, emails, SMS, Instagram, even QR codes on your product packaging. Offer clear benefits for downloading, like exclusive discounts or early access.

    __wf_reserved_inherit

    Once customers are in the app, they convert more often, spend more per order, and return more frequently. That’s ROI worth investing in from day one.

    Learn more: How to Launch Your Mobile App (Step-by-Step App Launch Playbook)

    2. The App Feels Worse Than the Website

    If your app looks and feels like a stripped-down version of your site (or worse, a generic app built from a template), there’s no reason for customers to use the app – since they can just get a better user experience, without downloading, on the web.

    Poor UX kills adoption fast. Especially when you’re trying to sell customers on downloading something that’s missing key features and functionality compared to your website.

    Rainbow Shops’ VP of Ecommerce, David Cost, said this regarding apps:

    “The app needs to be at least as functional as the website. It doesn’t need to be better than the website, but the user experience can’t be worse.”

    The fix: Make sure your app matches the quality of your website. With Vendrux, your app mirrors your website’s features, design, and experience – while adding the speed and convenience of a native app. There are no compromises, no features lost along the way.

    __wf_reserved_inherit

    3. Buggy, Broken, or Outdated Apps

    Apps require constant maintenance. It’s a common misconception that you just need to build once, and never have to touch the app again.

    __wf_reserved_inherit

    Without active maintenance, your app becomes a liability. Bugs go unfixed. New OS versions break functionality. Features lag behind your website. 

    The result? Frustrated users, negative reviews, and an app that slowly declines until it dies… and the brand takes this to mean that apps don’t work.

    The fix: When you’re building your app, choose a solution that keeps your app stable, up to date, and polished. 

    With Vendrux, your app stays synced with your website in real time, so your content and features are always up to date. More importantly, our team handles all technical upkeep, including updates for new iOS/Android releases, bug fixes, and quality assurance.

    You don’t need to hire developers or constantly check for issues. We proactively manage your app so it just works, and keeps your customers coming back.

    4. Ongoing Maintenance is a Burden

    Perhaps you are keeping your app up to date, but doing so becomes like running a whole new business in and of itself.

    Custom apps and many app builders come with hidden overhead. With custom apps, you’re either wrangling internal devs or coordinating with freelancers just to keep things working.

    This is what Tobi found – their custom ecommerce app needed an in-house team of six just to maintain.

    __wf_reserved_inherit
    Tobi found a better solution for their custom ecommerce site – converting their website into an app

    Then there’s the constant duplication of work with many app builders – making each update twice (once on your website, once on the app), which wears on your team over time.

    For most brands, it’s just not sustainable.

    The fix: Pick the right way to build an app. Don’t go with an option that creates more work. Vendrux handles your app’s maintenance, updates, and support. You manage everything from your existing site, with no new systems, no dev work.

    Vendrux is a service, not just a tool. Our team acts as your mobile app department so you don’t have to build one internally. You save massively on overhead as a result.

    5. You Spent Too Much to Build It

    A very common issue is brands spending huge amounts of money on a custom app, and facing a steep uphill climb just to make back the money they invested.

    If you spent $100,000 or more building your app, you need your app to really take off if you want to make a positive return. Even moderate usage looks like a failure.

    The fix: Keep it lean. We don’t recommend ecommerce brands to invest in custom development. The cost is far too much, and the minimal benefits are just not worth it.

    Vendrux helps you launch fully branded, premium apps for a fraction of the cost of custom development. Most brands recover the initial investment within weeks, thanks to increased conversion and engagement.

    There’s simply no business case for spending six figures on an ecommerce app when you already have a solid mobile site.

    6. Customers Forget About the App

    You might get a decent number of downloads, but these customers are not guaranteed to keep using the app.

    It’s easier than you think for someone to totally forget about your app. Most people have 50+ apps on their phone. Downloading an app is so easy that many people will download apps that end up buried and unused.

    Once you get the initial download, it’s essential to have a strategy to keep users engaged.

    The fix: Actively drive engagement. Push notifications are great for this. 

    Many people see push as just a direct response channel, used for promotions and product launches, but it’s much more than that. Regular push notifications keep your brand (and app) top of mind, and build constant awareness that prevents it from being forgotten.

    Send regular, non-pushy push notifications, especially in the early stages after download, when there’s the biggest drop-off in app retention.

    __wf_reserved_inherit

    Get more opt-ins, by communicating the value of push notifications upfront (and actually delivering that value), so you’re able to send push notifications to a higher percentage of your app users.

    Read more: Everything you need to know about Push Notifications for Ecommerce Brands

    7. There’s No Reason to Keep Using the App

    You need to ensure there’s a tangible benefit for customers to keep using the app long-term.

    This often happens if you front-load download incentives (like a one-time discount on the first app purchase).

    The result? Many shoppers download the app to get the discount, make a purchase, and then delete the app (or forget about it).

    You’ll get some power users who prefer the convenience of the app, but your overall app retention rates lead you to believe that it’s a failure.

    The fix: Build long-term value into your app. Offer app-only perks like early access to drops and promotions, app exclusives, or loyalty rewards. Make your best customers feel like insiders – part of an elite community.

    Use push notifications wisely, too, to provide real value that users can’t get on the website; fast order updates and alerts, useful tips, priority notification about new sales and drops.

    __wf_reserved_inherit

    Learn more: Exclusivity marketing: how to use mobile apps and exclusive experiences for sustainable growth.

    8. Your Brand Isn’t a Good Fit

    Not every ecommerce business is a good match for a mobile app. A furniture store, for example, doesn’t make as much sense for an app as a fast fashion brand.

    Mobile apps are great for brands with a high SKU count, high purchase frequency, strong impulse buy potential.

    If you have low purchase frequency or a tiny product catalog, your audience may simply not need one.

    The fix: Define your goals up front. Is your business the kind of business that could benefit from getting customers to browse your store more often, habitually open the app, and buy more often?

    If not, you might be better served focusing on another area of your business.

    9. Misaligned Expectations

    Many brands think their app was a failure because they simply expected too much.

    They thought it was supposed to double their revenue, or become their top sales channel.

    Apps typically contribute less sales than a brand’s mobile and desktop sites, simply because there’s more friction involved in downloading the app. Most customers will make their first purchase on the website; an app is unlikely to be a major acquisition channel.

    The fix: Set the right expectations. Mobile apps drive higher LTV, AOV, and retention among your top customer segment; usually your top 10-20% of customers. 

    So while there may be substantially fewer people using your app than shopping on your website, these customers generally give an outsized contribution to revenue (a brand might see 20% of total online revenue through their app, from just 10% of their customers, for example).

    As long as you keep costs in check and avoid unnecessary complexity, a small but engaged app audience can produce outsized results (and a clear positive ROI).

    Conclusion: Making Your Ecommerce App a Success

    Ecommerce mobile apps are a powerful growth lever for brands. But they’re not a magic fix.

    You need the right strategy to ensure that your decision to launch an app pays off. In summary, you need:

    • A clear app promotion strategy
    • A user experience at least as good as your mobile website (no missing features or inconsistencies)
    • Compelling reasons for customers (not all your customers – but your best customers) to keep the app downloaded
    • Strong early engagement, to keep your app and brand top of mind after someone downloads
    • A low enough investment (and overhead) to ensure a clear path to profitability

    At Vendrux, we’ve helped thousands of brands turn their websites into high-performing mobile apps, with zero duplication of effort and full-service support from day one.

    __wf_reserved_inherit

    If you’re serious about unlocking retention, LTV, and mobile-driven revenue (without the risk, waste, or technical headaches) we’d love to show you how it’s done.

    Just get a preview of your app, and you’ll be able to try out an interactive demo that shows you how well your existing site can function as a mobile app.

    There’s no need to rebuild, no need to reinvent the wheel. Just replicate what already works for you, in a more convenient package, for your best customers.

    Ready to build a mobile app that actually works? Get a free preview of your app now.

  • What Is Headless Ecommerce? A Complete Guide for 2026

    What Is Headless Ecommerce? A Complete Guide for 2026

    Most ecommerce platforms are built as a single, tightly bundled system. Shopify, BigCommerce, WooCommerce: they all work this way out of the box. Pick a theme, customize within the platform’s boundaries, manage everything in one place.

    That model works well until it doesn’t.

    At some point, growing brands run into limits: the checkout can’t be customized past a certain point, the page builder won’t support a new layout, or launching a mobile app means starting from scratch because the platform was only designed to serve a website.

    Headless ecommerce is the architectural response to those limits. This guide covers what it actually is, how it works, where it shines, and where it creates problems you didn’t have before.

    What Is Headless Ecommerce?

    Headless ecommerce (or headless commerce) decouples the frontend of your store (the storefront customers interact with) from the backend (the commerce engine that handles products, inventory, pricing, orders, and payments). 

    The two layers communicate through APIs instead of being wired together in one system.

    headless ecommerce development
    Source

    In a traditional setup, the backend dictates what the frontend can do. Your storefront is a layer of the platform itself, built within its templating system.

    In a headless setup, the backend provides data and functionality through APIs, and the frontend can be anything: a custom React website, a native mobile app, a voice interface, a kiosk in a physical store. The commerce engine doesn’t care how the data is displayed. It just delivers it on request.

    This separation is what makes headless flexible. Your developers aren’t constrained by a platform’s theme editor. They can build exactly the experience they want, with whatever frontend technology makes sense for the channel.

    Headless vs Traditional: At a Glance

    Traditional Headless
    Architecture Frontend + backend are one system Frontend + backend are separate
    Customization Limited to platform themes Build any frontend you want
    Channels Primarily web Web, apps, IoT, social, in-store
    Dev requirements Lower (platform handles most) Higher (need frontend devs)
    Time to customize Faster for basic changes Slower initially, faster ongoing

    How Headless Commerce Works

    On a technical level, APIs (Application Programming Interfaces) act as messengers between the backend and whatever frontends you build.

    Here’s the simplified breakdown:

    1. A customer visits your store (on web, in your app, or through another channel)
    2. The frontend sends a request to the backend via API: “Show me the products in ‘New Arrivals’”
    3. The backend processes the request and returns the data: product names, prices, images, inventory status
    4. The frontend receives that data and renders it according to its own design

    This happens for everything: product pages, search results, cart updates, checkout, order tracking. Every interaction between the customer-facing experience and the data layer goes through APIs.

    The practical upshot of this is you can run multiple frontends off the same backend. Your website, your iOS app, your Android app, and your in-store displays all pull from the same product catalog, share the same inventory, and process orders through the same system. 

    Update a price in the backend and it’s reflected everywhere, instantly.

    Benefits of Headless Ecommerce

    Here are some of the top reasons brands go headless:

    Full Frontend Flexibility

    This is the primary reason brands go headless. You’re no longer limited to what a theme editor allows. 

    • A completely custom product page layout
    • An unconventional checkout flow
    • An interactive lookbook that doesn’t fit any template

    All this is possible when your frontend is decoupled from the commerce engine.

    This matters most for brands where the shopping experience is the differentiator, like luxury, fashion, lifestyle brands where a generic storefront undermines the brand often hit the template ceiling first.

    Better Performance

    When the frontend is built independently, developers can optimize it specifically for speed. 

    They’re not loading an entire platform’s framework just to render a product page. Modern frontend frameworks (Next.js, Nuxt, Remix) enable static generation, edge caching, and code splitting that are difficult or impossible within traditional platform themes.

    The performance impact compounds at scale. Google’s research on Core Web Vitals consistently shows that faster page loads correlate with higher conversion rates and lower bounce rates.

    True Omnichannel Delivery

    Traditional platforms are built for one primary channel: the web. If you want a native mobile app, you either build it from scratch or use a service that connects to your backend separately.

    Headless makes omnichannel native to the architecture. The same commerce engine powers your website, your mobile apps, your in-store displays, and whatever channel comes next. One product catalog, one inventory system, multiple storefronts.

    This is where headless delivers the most long-term value. As commerce expands beyond the browser (into apps, voice, social, and physical retail), having an API-first backend means you can meet customers on new channels without rebuilding your infrastructure each time.

    Scalability

    API-based architectures handle traffic spikes differently than monolithic platforms. Because the frontend and backend are separate, you can scale each independently. A surge during a product drop or flash sale? Scale the frontend delivery layer without touching the backend.

    For brands running on cloud infrastructure, this means more efficient resource allocation and more graceful handling of peak traffic.

    Technology Freedom

    Headless doesn’t lock you into one vendor’s ecosystem. You can swap your CMS without touching your commerce engine. You can rebuild your frontend in a different framework without migrating product data. Each component of your stack can be upgraded independently.

    This is the foundation of composable commerce: the idea that your tech stack is assembled from best-in-class components rather than relying on one platform to do everything.

    Challenges of Going Headless

    Headless isn’t a universal upgrade. It comes with real tradeoffs that make it the wrong choice for many brands.

    Higher Complexity

    With a traditional platform, one vendor handles everything. With headless, you’re managing multiple systems: a commerce engine, a CMS, a frontend framework, potentially separate services for search, payments, and personalization. 

    Each integration point is something that needs to be built, maintained, and monitored.

    This isn’t insurmountable, but it requires either an in-house technical team or reliable agency partners. Brands without developer resources shouldn’t go headless.

    Higher Upfront Cost

    Building a custom headless frontend costs more upfront than using a platform’s built-in templates. Depending on the complexity, a custom headless build can run from $50,000 to well over $500,000 for enterprise implementations. 

    That’s before factoring in the headless CMS, search, personalization, and other services that a traditional platform bundles in.

    The cost equation shifts over time. Headless typically reduces the cost of ongoing changes and new channel launches. But the initial investment is significant, and you need enough revenue to justify it.

    Content Management Gets Harder

    In a traditional setup, your marketing team edits pages and updates banners through the platform’s built-in editor. In headless, content management usually requires a separate headless CMS, and the editing experience depends entirely on how well it’s set up.

    Some headless CMS platforms (Builder.io, Contentful, Sanity) offer visual editing that approaches the ease of traditional platforms. But it’s an additional system to configure, maintain, and pay for.

    Mobile App Delivery Isn’t Automatic

    Going headless solves the web frontend problem. It does not automatically give you a native mobile app. 

    Your headless backend can absolutely power an app (the APIs are there), but someone still needs to build, submit, maintain, and update that app on iOS and Android.

    This is where many headless brands stall when it comes to launching the last piece of their omnichannel strategy. They build the core infrastructure, but realize that building and managing multiple frontends is a lot more costly and complicated than expected.

    Headless Commerce in Practice

    Brands across categories have adopted headless for different reasons – some of these brands among the world’s biggest merchants.

    Nike rebuilt its digital experience on a headless architecture to support personalized, market-specific storefronts across dozens of countries, all powered by the same backend. The performance and personalization gains directly supported their shift toward direct-to-consumer sales.

    Target uses a headless approach to unify its web, app, and in-store experiences. The same commerce backend powers product data, pricing, and inventory across channels, which is critical for services like same-day pickup and delivery.

    Burberry went headless to deliver the kind of immersive, editorial shopping experience that luxury brands need but traditional ecommerce templates can’t support.

    Who Should Consider Headless Ecommerce?

    Headless makes sense when:

    • You’ve outgrown your platform’s templates. Your brand needs custom experiences that can’t be built within a theme editor or page builder.
    • You’re selling across multiple channels. Web, mobile app, marketplace, in-store, and you need them all pulling from the same backend.
    • You have developer resources (in-house or agency) to build and maintain custom frontends.
    • Your revenue justifies the investment. Most brands that benefit from headless are doing $10M+ annually. Below that, the ROI rarely justifies the added complexity.
    • You want to own your frontend roadmap. If you’re tired of waiting for platform updates or workarounds, headless puts the pace of innovation in your hands.

    Headless probably isn’t right if:

    • You’re early-stage and still iterating on product-market fit
    • Your team doesn’t include developers (and you don’t want to hire an agency)
    • A traditional platform meets your current and near-term needs
    • You’re looking for simpler, not more complex

    Popular Headless Ecommerce Platforms

    The platform you choose as your headless backend matters. Some are built headless-first; others are traditional platforms that now offer headless capabilities.

    • Headless-first platforms: Commercetools, Fabric, Medusa, Saleor
    • Traditional platforms with headless options: Shopify Plus (via Hydrogen/Oxygen), BigCommerce, Adobe Commerce (Magento), Salesforce Commerce Cloud

    Each has different strengths depending on your scale, team size, and technical requirements. See our full comparison of headless ecommerce platforms for detailed breakdowns.

    Getting Started with Headless Commerce

    If you’re evaluating whether to go headless, here are some tips for how to decide if it’s the right move; and to set yourself up for success.

    1. Audit your current limits. What’s actually holding you back? Is it frontend customization, performance, multi-channel delivery, or something else? Your constraints should drive the architecture, not the other way around.
    2. Choose your commerce engine carefully. This is the most consequential decision. Migrating commerce platforms later is expensive and disruptive. Pick one that matches your scale and team.
    3. Plan for mobile from day one. Modern brands need an app. A done-for-you service like Vendrux can launch a native app from your headless storefront in weeks, while a custom build takes months. Plan the channel strategy upfront.
    4. Build incrementally. You don’t have to go fully headless overnight. Many brands start by decoupling one part of their frontend (like the product page or checkout) and expanding from there. This reduces risk and lets you validate the approach before committing fully.

    Headless can be a great way to build and maintain flexibility in ecommerce. It’s not everything, and it’s not always the way to go. Assess the options and weigh up for your own store whether or not this makes sense.

  • What is Customer Retention Rate? The Key to Sustainable Ecommerce Growth

    What is Customer Retention Rate? The Key to Sustainable Ecommerce Growth

    Customer Retention Rate means the percentage of customers who continue to do business with you over a given time period.

    For ecommerce and direct-to-consumer (DTC) brands, this metric reveals how effectively you convert one-time shoppers into repeat customers.

    A high retention rate indicates stronger customer relationships. For ecommerce businesses, retention is crucial for sustainable growth. Many top brands now prioritize retention over acquisition, because of retention’s clear impact on profit-led growth.

    Vendrux helps ecommerce brands build mobile apps that drive higher retention rates, with minimal effort and investment. Want to learn how? Start with a free preview of your app now.

    Why Does Customer Retention Matter in Ecommerce?

    Customer retention drives profitable growth and long-term business health.

    Acquiring new customers is expensive; often 5× more costly than keeping existing ones.

    Retention is cheap, and pays off at an outsized rate. Data shows a mere 5% increase in customer retention can lift revenues by 25%–95%.

    This impact happens because loyal customers:

    • Buy more often
    • Spend more per order
    • Are 50% more likely to try your new products
    • Spend 31% more on average
    • Often become brand ambassadors, referring others to your brand

    Although repeat buyers might represent a minority of your total customers, they generate disproportionate value.

    Gorgias found that repeat shoppers make up only 21% of the average brand’s customers, but drive 44% of revenue.

    Ecommerce leaders like Glossier and Allbirds understand this dynamic. These brands cultivated communities and emotional connections that keep customers engaged beyond the first sale. Their loyal customers provide valuable feedback, positive reviews, and buzz on social media.

    Improving retention creates a virtuous cycle: more repeat sales, higher LTV, stronger loyalty, and less reliance on constant spending to get new customers.

    Key Retention Benchmarks for Ecommerce

    In ecommerce, customer retention rate is typically calculated as:

    Retention Rate = ((# of customers at end of period – # acquired during period) ÷ # of customers at start of period) × 100%

    For example, if you start the quarter with 1,000 customers and end with 900, having added 100 new customers in that time, your retention rate is (900–100)/1000 = 80%.

    Many ecommerce brands also track Repeat Purchase Rate – the percentage of customers who make more than one purchase. This is often an easier way to track retention for non-subscription businesses.

    Average retention rates in ecommerce are typically lower than other industries. Industry benchmarks are around 30%, meaning only about 3 in 10 customers return to buy again within the measured period.

    Retention varies widely by vertical:

    • Beauty & Cosmetics: ~26% average repeat purchase rate
    • Fashion & Apparel: ~25% repeat rate
    • Health & Supplements: ~29% repeat rate
    • Grocery/Pet Supplies: often 50%+ (highest categories)
    • Luxury Goods: as low as ~10% repeat within a year

    These benchmarks highlight that “good” retention is context-dependent.

    For a premium one-off product brand, a 20% repeat rate might be solid. However a daily-use product brand might aim for 50%+.

    There is a direct link between retention and customer lifetime value. Higher retention causes higher LTV.

    Studies show that after one purchase, there’s only a 27% chance a customer will return. But once they make a third purchase, the chance of another jumps to 54%.

    This shows the importance of the initial retention loop: getting a second and third purchase dramatically increases a customer’s long-term value to the business.

    How Do Ecommerce Apps Impact Retention?

    Mobile apps are a strong tool for improving retention, as a dedicated channel to engage customers post-purchase.

    Research finds app users are twice as likely to return to a store within 30 days compared to desktop shoppers. They also have higher conversion rates and bigger basket sizes due to the convenience and personalized experience an app provides.

    __wf_reserved_inherit

    Here’s more on why ecommerce mobile apps contribute to increase retention:

    Direct Communication via Push Notifications

    Apps enable push notifications – a powerful way to stay in touch with customers in real time. You can send useful, timely nudges such as:

    Push notifications have the potential to significantly increase repeat visits and purchases. The key is relevance and timing.

    Many successful brands use push as a retention lever. For example, Gymshark‘s shopping app sends alerts for exclusive “app-only” product drops, tapping into customers’ fear of missing out and driving repeat traffic.

    You can see more examples of brands successful using push notifications in our ultimate guide.

    In-App Loyalty Programs and Rewards

    Mobile apps are an ideal home for your loyalty program, making it easy for customers to track and redeem rewards.

    Brands can create a more gamified, engaging loyalty experience in-app:

    • Customers earn points for each purchase
    • They see progress toward the next tier or reward
    • They receive notifications when rewards are available

    This convenience and visibility boost participation. 83% of consumers say being part of a loyalty program influences their decision to buy again.

    Personalized Shopping Experience

    Apps can offer a level of personalization that’s harder to achieve via the web alone.

    By leveraging user data (browsing history, past purchases, preferences), the app can dynamically showcase tailored products and content.

    Personalized offers and product suggestions make customers feel understood, valued. This directly influences retention. That’s why 91% of consumers say they’re more likely to shop with brands that provide relevant, personalized offers.

    Ecommerce apps excel at this: they can greet users by name, remember sizes or saved items, and even use AI to curate “just for you” sections. The result is higher engagement and more frequent shopping, as the app becomes like a personal storefront for each customer.

    A Frictionless User Experience

    A great app makes the post-purchase and ongoing shopping experience fast and frictionless, which encourages loyalty.

    Friction makes shopping frustrating. Frustration reduces loyalty, and makes shoppers search for alternatives.

    A smooth UX (quick load times, one-click reorders, easy payment options, and saved shipping info) removes barriers to purchase.

    When customers find an app convenient and enjoyable, it becomes their preferred way to shop your brand, naturally lifting retention.

    Community and Content Integration

    Ecommerce apps can go beyond transactions to build a community around the brand. Some innovative DTC brands are embedding community features or content feeds in their apps to increase engagement.

    An example is Gymshark launching the Gymshark Training app, which provides workout ideas and connects users in a fitness community, as a complement to Gymshark’s shopping app.

    Beauty brands often integrate content like tutorials, blog posts, or customer looks into their apps. This gives customers reasons to open the app even when they’re not immediately buying something, keeping them engaged for longer.

    Over time, this deeper engagement leads to higher retention because customers feel part of a like-minded tribe.

    What Strategies Improve Customer Retention?

    Here are some ways to actively drive higher customer retention for DTC brands.

    Deliver Outstanding Customer Service

    Customer retention starts with customer satisfaction. Ensure your support is responsive and helpful across all channels – app chat, email, social, etc.

    Fast and friendly customer service significantly boosts repeat business. Gartner research found that when customers feel they received great service, there’s an 82% probability of buying again.

    Train your team (or chatbot/AI assistants) to resolve issues quickly. A smooth return process can turn a potentially negative experience into a loyalty-building moment.

    43% of customers will stop buying from a brand after a single bad experience. So preventing those missteps is key.

    Implement a Loyalty or VIP Program

    Launch a loyalty program to reward repeat customers.

    This doesn’t have to be complex. Even a simple point-per-dollar and coupon reward system can work as a quick win.

    The goal is to give customers a tangible incentive to choose you again. Loyalty programs both increase repeat purchase rates, as well as fostering emotional ties to the brand.

    Consider tiered VIP levels (e.g., Bronze, Silver, Gold) to encourage progression. Brands with well-run loyalty programs see 15–25% higher annual revenue from their loyal customers.

    Use Personalization and Segmentation

    Avoid blasting the same message to everyone. Segment your customers and personalize communications to their behavior and preferences.

    At a basic level, separate your one-time buyers from your repeat customers and communicate differently to each:

    • New customers might get a “welcome” series with a first-repeat-purchase discount
    • Loyal customers might get a “VIP sneak peek” of upcoming launches

    In your app, use segmentation for push notifications: if a segment of customers only buys skincare, send them skincare content, not generic promos.

    Done right, personalization shows customers you understand them, increasing their affinity for your brand.

    Streamline the Reorder Experience

    Make it as easy as possible for customers to buy from you again.

    Eliminate friction in the reordering process by:

    • Adding “Buy Again” or “Reorder” buttons in your app
    • Sending replenishment reminders for consumable products
    • Offering subscribe-and-save options for eligible products
    • Optimizing your checkout flow for speed, especially on mobile
    • Enabling one-click checkout options

    The less hassle a customer faces, the more likely they’ll come back rather than drift to a competitor.

    Engage Customers with Content and Community

    Building a sense of community can significantly improve retention, as customers feel they’re part of something bigger than a transaction.

    Glossier famously built its brand on community engagement starting with its Into The Gloss blog, and now a fervent social community, which keeps fans emotionally invested.

    __wf_reserved_inherit

    You can do the same by creating content that resonates with your audience’s lifestyle or values:

    • Publish styling tips if you’re a fashion brand
    • Host live Q&As or how-to videos in your app
    • Create a forum for customers to share and discuss

    Brand-run communities can turn customers into loyal fans who stick around for the community and identity, as much as the product.

    Solicit Feedback and Act on It

    Show customers that their voice matters. After the sale, ask for feedback through brief surveys or in-app prompts.

    Not only can this uncover issues to fix (preventing silent churn), but closing the feedback loop makes customers feel heard.

    Smart DTC brands use customer feedback in product development. This approach signals that you value the customer beyond their dollars, building loyalty.

    Additionally, reach out to lapsed customers to understand why they haven’t come back. A friendly “we miss you” email (or push notification) with a small incentive can both win them back and reveal pain points.

    Align Retention Tactics with Your Brand Identity

    Make sure your retention tactics feel authentic to your brand. A common pitfall is copying generic tactics that don’t fit your brand’s ethos.

    For example, if your brand is positioned on luxury and exclusivity, blasting big coupon codes might undermine that premium image.

    Instead, focus on white-glove service and exclusive access as retention rewards.

    Brand consistency matters. Retention efforts should enhance the customer’s connection to your brand story, not contradict it.

    Learn more: Read how Country Life Natural Foods uses their mobile app to massage buyers along the path to becoming long-term, engaged buyers who stick around for life.

    Common Retention Pitfalls to Avoid

    Here are some of the ways brands commonly go wrong when trying to grow retention.

    Over-Communication and Notification Fatigue

    Bombarding customers with constant emails, texts, or push alerts can annoy them into quitting on you.

    There’s a fine line between being engaging and being spammy.

    Quality over quantity is key – a few well-timed, relevant touches beat a barrage of noise. Monitor unsubscribe rates and app notification opt-outs as warning signs.

    Lack of Segmentation (One-Size-Fits-All)

    Treating all customers the same will hurt your retention efforts. A new customer has different needs than a 5-time buyer.

    Blasting the same offer to everyone reduces effectiveness, and feels impersonal or irrelevant. Avoid this pitfall by using even basic segmentation: by purchase history, demographics, or engagement level.

    Segmentation and relevance are the antidotes to attrition. Customers stick around when the experience speaks to them.

    Misaligned Retention Incentives

    Ensure your retention tactics don’t inadvertently train customers to behave in ways that hurt your business. A classic example is over-reliance on discounts.

    If every communication includes 20% off, customers might learn to never buy at full price.

    Design your loyalty incentives to encourage the behaviors you do want (repeat purchases, referrals, higher basket sizes) and cap or exclude things that could be gamed.

    Keep your program simple and aligned with value for both the customer and you. The best retention strategies deepen the customer’s connection to your brand’s mission, not just its wallet.

    Ignoring Churn Signals

    Don’t focus solely on happy repeat customers. Pay attention to those slipping away as well.

    A pitfall is to pour all your resources into marketing campaigns without analyzing why customers churn.

    Make sure someone on your team is actively reviewing churn metrics and qualitative feedback. Plug the leaks by addressing core issues: fix product problems, adjust pricing, or change your onboarding for better expectation-setting.

    Set up win-back flows for lapsed customers. A friendly reminder or exclusive comeback offer can re-engage some of them.

    What Are Some Quick Wins for High Retention ROI?

    For teams with tight budgets or small staffs, focusing on a few high-impact, low-effort retention wins can deliver excellent ROI:

    • Optimize your thank-you and follow-up: After a first purchase, send a warm thank-you email with a next purchase coupon or useful content. This simple gesture can gently nudge a second purchase.
    • Re-engage with a “We Miss You” offer: Identify customers who haven’t bought in 90 days and trigger a win-back message with a small discount or personalized note.
    • Leverage Social Proof and Referrals: A referral program (e.g., “Give $10, Get $10”) can be a quick add-on that not only brings new customers but also retains the referrer by rewarding them.
    • Speed up your website/app: Improving page load times and reducing glitches in your app is an often overlooked retention win. A fast, easy shopping experience will quietly keep customers coming back.
    • Double-down on best sellers & subscription options: Analyze which products have the highest repeat purchase rates and make those prominent. Consider offering these as subscriptions in-app with a small discount.

    What’s the Future of Retention?

    Looking ahead, customer retention strategies are poised to become even more sophisticated:

    AI and Predictive Analytics

    Machine learning models can sift through customer data to predict churn before it happens, flagging which customers are at risk so you can stop them from churning.

    The DTC hydration brand Hydrant used predictive AI to identify likely churners and target them with tailored offers, resulting in a 260% higher conversion rate and a 310% boost in revenue per customer.

    Zero-Party Data Focus

    In a privacy-conscious world, brands will lean heavily into zero-party data – information that customers proactively share with you, such as preferences or intentions.

    Ecommerce apps will increasingly ask customers for this input through quizzes, style surveys, and wish lists. In return, brands will offer hyper-personalized experiences that keep customers loyal.

    App-Native Communities

    Gen Z and younger consumers are blending social interaction with shopping. Forward-thinking DTC brands may incorporate community feeds, user galleries, or live shopping events into their apps.

    These community elements deepen engagement and give customers a reason to open the app even when they’re not actively shopping, which leads to more frequent purchases over time.

    Lifetime Relationship Emphasis

    Retention strategies will increasingly emphasize lifetime customer relationships over single transactions. We might see metrics like “10-year customer value” or “customer advocacy index” gaining prominence.

    More brands may launch membership programs that bundle perks, content, and community, creating a moat of benefits that make leaving undesirable.

    Retention: The Engine Behind Sustainable Growth

    Acquisition gets the headlines, but retention wins the long game. A small boost in how many customers stick around can massively impact revenue. Why? Because repeat buyers, while often a minority, drive the majority of profits.

    As ecommerce evolves, one thing stays the same: keeping customers coming back is essential.

    For founders and marketers, the opportunity is clear:

    • Invest in customer experience.
    • Communicate thoughtfully (not endlessly).
    • Build real community.

    Avoid cookie-cutter tactics. Personalization isn’t a nice-to-have – it’s the playbook. The brands that win treat customers like relationships, not receipts.

    Mobile apps are proving to be retention goldmines. They offer what websites can’t – direct lines of communication, tailored experiences, and frictionless reordering.

    You can launch your own mobile app now, for minimal effort and expense, just by converting what already works – your website.

    Get a free preview now to see what’s possible, or check out our homepage to learn more about how it works.

  • What is Average Order Value (AOV)? A Major Revenue Multiplier for Ecommerce

    What is Average Order Value (AOV)? A Major Revenue Multiplier for Ecommerce

    Average Order Value (AOV) is the average amount a customer spends in each transaction.

    It’s calculated by dividing total revenue by the number of orders. For example, if your online store made $10,000 from 100 orders this month, your AOV would be $100.

    As of late 2024, the global average AOV was around $144 (approx. £114), an 8.7% increase year-over-year. This metric varies widely by sector: luxury and jewelry orders average >$400, while beauty and personal care hover around $70.

    Why should business leaders care about AOV?

    Because increasing AOV boosts revenue and profitability without requiring new customers. A higher AOV means more items or higher-priced products per checkout, which improves profit margins and helps cover marketing and fulfillment costs.

    Want to drive consistently higher AOV from your mobile shoppers? Try launching a mobile app. Use our eCommerce App Revenue Calculator to see just how much you can add to your business by launching your app.

    Why Does AOV Matter for Growth and Profitability?

    AOV isn’t just a vanity metric; it has real strategic importance for ecommerce businesses.

    When you increase the average value of each order, you’re getting more revenue out of each customer visit, for no extra cost.

    This dramatically improves profitability, because the costs to acquire or serve that customer (marketing, shipping, transaction costs) can be spread over a larger purchase size.

    If it costs you $10 in ads to get a customer to your site, having them spend $100 versus $50 in that session makes a huge difference to your bottom line.

    Higher AOV improves your return on ad spend (ROAS) and makes customer acquisition campaigns more sustainable. Moreover, AOV ties into customer lifetime value (CLV). If customers spend more per order, they’re almost certainly going to contribute higher lifetime value.

    A high AOV can also signal strong product-market fit or effective merchandising. It might mean customers love your products enough to buy multiples or add complementary items.

    Industry Benchmarks for AOV

    When assessing your AOV, it’s useful to compare against benchmarks in your industry. What’s considered a strong AOV differs vastly between a luxury fashion retailer and a grocery delivery service.

    By late 2024, the global average AOV across online retail was about $144.52 (approx. £114.25), an increase of 8.7% from the previous year.

    AOV has been trending upward annually, partly due to inflation and partly due to successful upselling strategies by retailers.

    By Industry:

    • Luxury & Jewelry: The highest AOV, around $436 per order on average
    • Home & Furniture: Approximately $253 per order
    • Consumer Electronics/Equipment: In the $200+ range
    • Fashion & Apparel: Around $196 per order
    • Food & Beverage: Around $114 per order
    • Pet Care: Roughly $83 per order
    • Beauty & Personal Care: Only about $71 per order on average

    These benchmarks highlight how AOV reflects product price points and purchasing patterns. Luxury is high because even one item is pricey. Beauty is low because items are cheap and often bought one at a time (unless bundled).

    It’s also useful to note seasonality: AOV can jump during holidays (customers buy more items for gifts per order) and can dip in off-season periods. In one fashion industry analysis, order values peaked in spring around April to May and again during fall, aligning with seasonal refreshes and holiday prep.

    What Strategies Increase AOV in Ecommerce?

    Ecommerce brands use various tactics to encourage customers to add extra items or choose premium options (and thus spend more in each order).

    The overarching principle is to provide additional value or convenience that makes a larger purchase natural and appealing.

    Upselling and Cross-Selling

    Upselling means suggesting a higher-end or higher-volume version of the product the customer is considering, while cross-selling means recommending complementary products.

    A classic cross-sell is Amazon’s “Frequently Bought Together” and “Customers also bought” sections, a strategy so effective that a McKinsey report estimated 35% of Amazon’s sales come from recommendations like these.

    __wf_reserved_inherit

    Product Bundling

    Product bundling means selling multiple related items as a package, often at a slight discount or with added convenience, to encourage a larger total purchase.

    Bundles can take many forms: a bundle of complementary items (e.g., camera + lens + bag sold together), a “kit” or set of products that go well together (e.g., a skincare routine set with cleanser, toner, and moisturizer), or a bulk pack of the same product.

    The idea is to increase the units per transaction, thereby increasing the order value. Bundles create a sense of value and savings, the customer feels they’re getting more for a good price. They also simplify decision-making.

    Loyalty and Rewards Programs

    A loyalty or rewards program can elevate AOV by incentivizing customers to spend more to earn rewards or reach the next tier of benefits.

    Customers will usually add extra to their cart if they know it earns them something tangible in return. “Spend $100 to get 100 points and a $10 reward” can prompt a $90 cart to creep over the $100 mark.

    Data supports this; one study found that customers who redeem points when purchasing spend 39% more on that purchase, on average.

    A great example is Sephora’s Beauty Insider program. Sephora’s loyalty members tend to have higher average spend; they are often tempted to add one more item to get the next 100-point perk or to use a promotional code that requires a minimum spend.

    Dynamic Free Shipping Thresholds

    Offering free shipping above a certain cart value is one of the oldest and most effective tactics to increase average order value.

    People hate paying for shipping. So when you present a threshold (e.g., “Free shipping on orders over $50”), many will add extra items to avoid the fee.

    The key is to set the threshold strategically just above your current AOV or target AOV. For example, if your typical order is $45, you might set free shipping at $60. Customers with $45 in their cart see that they’re close to free shipping and often will find something to add to reach $60.

    A study by Salesforce in 2024 noted that your free shipping threshold should be roughly 30% higher than your current AOV, high enough to push customers, but not so high that it feels unreachable.

    Personalization and Product Recommendations

    Personalization involves tailoring the shopping experience to each user’s preferences and behavior. It’s a powerful driver of larger basket sizes when done correctly.

    Modern shoppers have come to expect some level of personalization. Surveys show that 80% of customers say the shopping experience should be better tailored given all the data companies collect, and 65% expect companies to adapt to their preferences.

    According to Salesforce’s data, personalized product recommendations now account for 26% of total ecommerce revenue on average, despite being a small fraction of the content shown. That underscores how effective relevant suggestions can be.

    How Can Mobile Apps Drive Higher AOV?

    Mobile apps consistently outperform desktop and mobile websites when it comes to AOV. The majority of brands see anywhere from 10-50% higher AOV from transactions in their mobile app.

    Here’s why.

    App-Exclusive Offers and Features

    Many brands now offer mobile apps not just for convenience, but as a channel for VIP customers with exclusive perks. App-exclusive offers can significantly boost AOV by giving customers reasons to shop in the app and load up their cart.

    The psychology here is treating app users as an insider club. When customers feel they’re part of a privileged group, they often engage more deeply and spend more.

    One concrete example: BÉIS, a travel accessories brand founded by Shay Mitchell, leveraged its mobile app to create a VIP experience. They share behind-the-scenes content and product drops exclusively on the app. The result? App users of BÉIS have a 19% higher AOV compared to those on the mobile website.

    Mobile UX Improvements

    Improving the mobile user experience (UX) of your store whether in-app or mobile web, can indirectly but meaningfully raise AOV.

    A huge portion of ecommerce traffic is now on mobile devices (mobile commerce comprised about 35% of sales during Cyber Week 2024).

    If the mobile experience is clunky, customers may limit their browsing or stick to one item and checkout quickly (or abandon). A smooth, engaging mobile UX encourages users to view more products and complete multi-item purchases.

    Key areas of mobile UX that impact AOV include: navigation and discovery, site speed, and checkout ease. If your app or mobile site makes it easy to find related products (through intuitive menus, filters, or recommendation carousels), users are more likely to add those items.

    What Real-World Results Have Brands Achieved?

    Let’s look at some real-world examples of how direct-to-consumer (DTC) and ecommerce brands have implemented AOV-boosting strategies:

    BÉIS (Travel Goods)

    By funneling their most engaged customers to the app and offering app-exclusive content and early product access, they cultivated a community that shops more frequently and in higher amounts. The app saw a 19% higher AOV than the mobile website.

    Kopari Beauty (Personal Care)

    This brand implemented a “buy more, save more” upsell on product pages. For instance, on a product that normally sells as one unit, they offer a duo at a discounted rate. This kind of upsell led many customers to choose the 2-pack, effectively doubling the revenue from that order minus a small discount.

    John’s Crazy Socks (Apparel/Gifts)

    This brand’s gift wrap add-on is a simple cross-sell at checkout that adds $2 to the order. For a company that sells socks (low-priced items), getting an extra $2 is significant proportionally.

    La Roche-Posay (Beauty)

    La Roche-Posay implemented a free gift with purchase over $X promo, “Get a 4-piece sample kit on orders $70+”. This effectively increased their AOV as customers aimed for that $70 basket.

    MeUndies (Apparel)

    The underwear brand has a section called “Match Me” to encourage buying for couples, matching underwear sets for you and your partner. This is a clever cross-sell where they tap into a social/shared experience to increase AOV.

    How Can Your Brand Achieve Higher AOV?

    Many AOV-boosting tactics can be implemented incrementally and with modest resources, especially if you’re using modern ecommerce platforms like Shopify, WooCommerce, or BigCommerce.

    Start with the Low-Hanging Fruit

    Some changes require just a small tweak or addition. For example, setting a free shipping threshold is usually a basic setting in your store’s shipping options, decide on a threshold (use your current AOV + ~10-20% as a guideline to start), and update your shipping settings.

    Similarly, creating a few product bundles can be as easy as adding new bundle products in your catalog (or using a bundling app). You don’t need a fancy algorithm to pick a couple of complementary products and sell them together at a discount.

    Leverage Apps and Integrations

    You don’t have to custom-build everything. There are one-click upsell apps, cross-sell recommendation apps, loyalty program apps, etc. For instance, on Shopify, apps like ReConvert or Candy Rack handle post-purchase and in-cart upsells; Smile.io or LoyaltyLion can launch a basic loyalty points program quickly.

    Evaluate which tactic might yield the best ROI for you and try an app in that category. (Pro tip: implement one major app at a time and measure results, rather than 5 at once, to know what’s moving the needle.)

    Use Your Existing Content and Channels

    If building personalization algorithms is out of reach, you can still personalize in simpler ways. For example, manually create “Recommended” collections on your site and promote those in your marketing emails or homepage.

    Use your email newsletter or SMS to encourage larger baskets: send an email saying “Our top picks to complete your skincare routine” highlighting items that go well together.

    Focus on Customer Value (Not Just Your Revenue)

    AOV tactics should ideally create a better experience for the customer. Brainstorm from the customer’s perspective: “What would I find useful or delightful that might also make me spend more?”

    If you approach AOV increases through the lens of adding customer value, you’re more likely to succeed and not face backlash. Plus, satisfied customers tell friends and come back (long-term benefits beyond one order).

    What Pitfalls Should You Avoid?

    Watch out for these things as you strive to boost AOV in your online store:

    Over-emphasis on AOV vs. Other Metrics

    Chasing AOV in isolation can lead to decisions that hurt other parts of the business. For example, you might push an upsell that indeed raises AOV but annoys customers, causing a drop in customer satisfaction or conversion rate.

    Is it better to have a higher AOV or a higher conversion rate? Ideally both, but sometimes there’s a trade-off. If upsell prompts are too aggressive, some customers might abandon carts. AOV of completed orders might rise, but overall sales could fall if conversion tanks.

    Many experts stress balancing AOV with metrics like conversion rate, lifetime value (LTV), and customer retention. A holistic view is needed: it’s the long-term revenue and profit per customer that matter, not just squeezing out one big order.

    Customer Experience Backlash

    Some AOV tactics can feel like nickel-and-diming. For instance, if a site bombards users with add-on offers at every click, it can degrade the experience.

    Similarly, setting a free shipping threshold too high above typical order value might frustrate customers who feel it’s unattainable, potentially driving them to competitors.

    The strategic debate here is short-term AOV vs. long-term loyalty. As one source pointed out, fostering loyalty tends to have higher long-term ROI than single-mindedly boosting AOV at the expense of customer satisfaction.

    Discount Dependency

    Relying too heavily on discounts or promotions to drive up AOV can train customers to only buy when there’s a deal. This can erode margins and brand premium over time.

    There’s also the pitfall of margin impact: If you raise AOV by giving large volume discounts, ensure you’re not sacrificing so much margin that the higher revenue doesn’t translate into higher profit.

    How Vendrux Helps You Drive Higher AOV

    Want a proven way to raise your AOV while delighting your best customers? Launch a mobile app, with Vendrux.

    __wf_reserved_inherit

    Vendrux transforms your existing website into a fully branded iOS and Android app, without needing to rebuild or manage anything separately.

    Your app mirrors your current site and tech stack, but adds the mobile-native elements that boost engagement, conversions, and importantly, order value.

    Here’s how a Vendrux-powered app helps lift AOV:

    • Larger carts, consistently: Brands using Vendrux typically report 30% higher AOV from app users. Mobile apps create a smoother, distraction-free experience that keeps customers browsing and buying more.
    • Built-in loyalty and retention: The app becomes a hub for loyalty programs, app-only offers, and personalized perks, giving customers more reason to hit higher cart values.
    • Push notifications that convert: Tap into the most effective channel for re-engagement. Vendrux helps you run high-performing push campaigns that drive users back in with personalized, time-sensitive offers that increase basket size.
    • One-tap upsells and frictionless UX: Your app offers an Amazon-like UX with one-click add-to-cart and checkout. It’s designed to maximize conversions and order volume on mobile – where the majority of ecommerce traffic happens.

    Most importantly, this isn’t another tool you need to figure out yourself. Vendrux is a done-for-you, service-driven solution.

    Our team handles everything, from setup, QA, and App Store submission to strategic support post-launch, to make sure your app actually drives meaningful ROI.

    Ready to see what your brand’s app could look like? Get a free preview and see how easy it is to turn your mobile traffic into higher revenue and repeat purchases.

    Final Thoughts: AOV as Your Growth Engine

    Unlike chasing new customers, boosting AOV means earning more from people already in the door. That’s higher profit, less spend. In a world where acquisition costs keep climbing, this is a strategy you can’t ignore.

    The best part? It’s not about tricks. It’s about enhancing the customer experience. Think:

    • Smart upsells and cross-sells
    • Loyalty perks
    • Personalized recommendations
    • Bundling or volume discounts

    Done right, it’s a win-win. Customers get more value, you get bigger checkouts.

    Want to lift AOV? Start here:

    • Personalize the path to purchase (think: “You might also like…”)
    • Make checkout frictionless (1-click, digital wallets)
    • Use incentives strategically (free shipping thresholds, bundle deals)
    • Highlight social proof to build trust on higher-ticket items

    The future of AOV optimization is all about personalization, tech that feels invisible, and authentic customer engagement. Brands that do this well will enjoy better margins and customer loyalty.

    Remember: AOV isn’t just a number. It’s a reflection of how well you’re delivering value – and how much trust your customers place in you to deliver more.

  • The Role of Trust Signals in Reducing Cart Abandonment

    The Role of Trust Signals in Reducing Cart Abandonment

    Cart abandonment is bleeding revenue from your business – more than 70% of online shoppers bail before checkout. 

    In most cases, it’s not about price or interest or their internet cutting out. It’s about trust. 

    Shoppers hesitate because they’re unsure about security, product quality, customer service, or whether their order will even show up.

    The good news? Trust isn’t just a vague concept. It’s a conversion lever. The right trust signals, placed strategically, will turn hesitation into confidence and recover lost revenue.

    In this article, we’ll break down:

    • Why trust makes or breaks conversions (and what’s really driving cart abandonment).
    • The most effective trust signals top brands use to increase checkout rates.
    • Real-world examples of trust-building tactics that work.
    • How to measure, test, and optimize trust signals to drive long-term sales.

    Let’s get into it.

    Want more insights from what 8 and 9 figure brands are doing to boost retention, LTV, and build sustainable revenue streams? Check out our free weekly newsletter, The Retention Edge.

    Why Trust is the Difference Between a Conversion and an Abandoned Cart

    Trust isn’t just a vague concept – it’s a hardwired psychological trigger that decides whether a shopper checks out or walks away.

    The Psychology of Consumer Trust

    Online shopping strips away the physical touchpoints that help customers evaluate products in-store. 

    Without the ability to see, feel, or test an item, shoppers rely on digital trust markers to decide if a brand is legit, high-quality, and worth their money.

    And the data backs this up. Baymard Institute’s research confirms that trust perception directly impacts checkout completion rates. 

    Their large-scale user testing shows that any element that creates doubt – unpolished design, missing reviews, vague product descriptions, or absent security badges – dramatically increases cart abandonment.

    This problem escalates with:

    • First-time buyers (no prior brand relationship).
    • Lesser-known brands (fewer external trust signals).
    • High-ticket items (greater perceived risk).

    Think about it: Buying a $20 t-shirt from Gap requires little trust. But dropping $2,000 on a sofa from a brand you just found on Google? That’s a whole different level of risk.

    The bigger the purchase, the higher the trust bar.

    __wf_reserved_inherit
    A ~$1,400 purchase requires a significant amount of trust. See how many trust signals are featured on HexClad‘s checkout

    How Lack of Trust Kills Conversions

    Fear of Fraud

    Customers won’t hand over sensitive payment details if they sense even a hint of risk. 

    Concerns about credit card scams, phishing, and identity theft make secure checkout experiences and trusted payment methods non-negotiable.

    Doubts About Product Quality

    Shoppers can’t hold, feel, or test your product, so your product page has to do the selling. 

    Missing reviews, low-quality images, weak descriptions, or inconsistent product details make customers question if what they’re seeing is what they’ll actually get.

    Concerns About Customer Service

    People hate bad customer service. If your site hides shipping timelines, has a vague return policy, or lacks clear contact options, customers assume the worst. 

    And if they’ve been burned before by slow shipping or difficult returns, they’ll bounce fast.

    The bottom line? A lack of trust doesn’t just slow sales – it actively repels customers. If you’re not addressing trust issues, you’re leaving money on the table.

    The Most Effective Trust Signals for Reducing Cart Abandonment

    So how do you proactively build trust and turn hesitation into high-converting confidence?

    By embedding the right trust signals and reducing perceived risk at every step of the customer experience.

    Here’s where you’ll get the biggest impact:

    Security & Payment Trust Signals

    Even small amounts of friction or uncertainty around payment security can derail potential purchases. 

    Implement visual cues like:

    • SSL certificate and “https://” in front of your URL to show you have a secure, encrypted checkout process. Make sure your SSL is from a trusted provider.
    • Trusted payment options: Prominently display logos of major credit cards, PayPal, Apple Pay, Google Pay, Klarna, and other payment methods shoppers know and trust.
    • PCI DSS compliance badge (if applicable): Shows that customer data is handled according to rigorous security standards.
    • Fraud protection messaging: Add microcopy like “100% secure checkout”, “Your payment information is protected by industry-leading encryption”, etc.
    __wf_reserved_inherit
    Trusted payment services are not only convenient for customers, they also improve trust and reduce the fear of handing over your card details to an unknown website (via Everyday Dose)

    A study of 130 online sellers in Europe and Latin America found that adopting third-party assurance seals led to increased online sales for 66% of those companies.

    If you’re struggling with low conversions or high abandonment rates, this is definitely something to test.

    Social Proof & Reviews

    The power of social proof for building trust and driving sales cannot be overstated.

    • Star ratings on product pages: Include the number of reviews to increase perceived credibility.
    • Detailed customer reviews: Allow customers to leave in-depth feedback, include photos/videos, and respond to questions.
    • Customer photos and videos: Featuring real customer-generated content demonstrates authenticity.
    • Social proof pop-ups: Display recent purchases or product reviews as unobtrusive notifications, sparking interest and FOMO.
    • Third-party review widgets: Aggregate reviews from sites like Trustpilot, Google, Facebook, and the BBB to provide external validation.

    Virtually all online shoppers rely on reviews. A 2021 consumer survey found 99.9% of consumers read reviews and 98% consider them an essential step in their purchase decision process​. 

    86% of shoppers won’t buy a product at all without reading reviews first​. And a product with just 5 reviews has a purchase likelihood 270% higher than a product with no reviews at all​, according to analysis of purchase behavior from Northwestern University’s Spiegel Research Center.

    Showcase positive customer sentiment and opinions from real people wherever possible.

    __wf_reserved_inherit
    &Collar displays vital trust signals such as social proof on their checkout page

    Return & Refund Policies

    Worry about the potential hassle and cost of returns keeps many shoppers from completing their orders.

    Boost confidence with:

    • Generous, easy-to-find return policies: Offer at least 30 days and make the terms clear – “Free 30-day returns, no questions asked.”
    • Money-back guarantees: Put shoppers’ minds at ease with “100% satisfaction guaranteed or your money back.”
    • Prepaid return labels: Cover the return shipping yourself to remove friction.

    According to a UPS consumer survey, 88% of online shoppers review a retailer’s return policy at some point during their shopping journey, and 66% specifically check the returns policy before committing to a purchase. 

    15% of shoppers abandon their shopping cart altogether due to an unclear or unsatisfactory return policy. Returns are an extra cost, but making it easier for the customer is also a proven way to increase conversions.

    __wf_reserved_inherit
    Caraway builds trust on their checkout page with shipping transparency, free returns, package protection, social proof and more

    Shipping & Fulfillment Transparency

    Unexpected shipping costs are the #1 reason for cart abandonment. And with retail giants like Amazon normalizing free and fast delivery, shoppers won’t settle for less.

    Display things like:

    • Estimated delivery dates: Display a dynamic estimated arrival date at checkout based on the shopper’s location and chosen shipping speed.
    • Free shipping thresholds: Incentivize larger orders by offering free shipping on purchases over a certain amount. Clearly display the free shipping cutoff in the cart.
    • Order tracking: Send proactive updates and let customers check their order status online. Transparency reinforces trust post-purchase.
    __wf_reserved_inherit
    Skims offers transparency over shipping and processing times, and also explains how customers can get free returns and faster processing times (by downloading their app)

    Brand Credibility Indicators

    The best trust signal is a well-known brand.

    Notice how Apple doesn’t have reviews on their product pages? They don’t need them. The Apple brand conveys far more trust than any customer review.

    The more trust and familiarity you build in your brand, the less you’ll rely on trust signals like reviews and badges.

    Do this through:

    • Press mentions or industry awards: “Featured in Vogue, GQ, and Men’s Health.”
    • Founder’s story and brand mission: Putting a human face to the brand through an authentic About Us page builds emotional investment.
    • Value-add trust badges: “Cruelty-free”, “Sustainably made”, “Veteran-owned”, etc.
    • Mobile apps: A brand with a mobile app feels more legitimate. “Get It On Google Play”, “Download On The App Store” – leverages the trust that comes with these brand names.
    __wf_reserved_inherit
    An app is a great way for any brand to boost credibility and trust

    Don’t have an app yet? If you have a mobile-friendly website, you’ve done 90% of the work already. Click here to see how you can launch your own app with zero effort and the cost of less than a day’s sales.

    Measuring & Optimizing for Trust-Driven Conversions

    Adding trust signals is an ongoing process, not a one-and-done initiative.

    Crucially, while the lessons in this article represent research-backed best practices, they won’t apply to every brand and every audience.

    You may find that certain trust signals work less effectively, or even have a negative impact on conversions.

    For example, a Streetwear brand putting a Norton/McAfee Secure trust seal next to their checkout button would likely hurt conversions – but the same badge on Best Buy might have a positive impact.

    You should test everything, compile the most important metrics, and see what moves the needle for your brand.

    Key Metrics to Track

    These metrics will tell you whether your trust signals are having the desired effect:

    • Cart abandonment rate: Monitor how new trust signals affect the percentage of carts that convert into sales.
    • Exit rate at each checkout step: Identify where trust barriers are causing shoppers to drop off mid-purchase. Focus on the pages with the highest exit rates first.
    • A/B test variations: Use split tests to see which trust signal placements, anchor text, badge designs, and review widgets perform best.
    • Post-purchase surveys: Ask “What almost stopped you from completing your purchase today?” to surface lingering trust issues.

    Iterative Improvements for Long-Term Trust

    Try the following initiatives, alongside adding the trust signals mentioned above, to improve conversion rate and reduce cart abandons.

    • Heatmaps and session recordings to see where shoppers are getting stuck, rage clicking, or u-turning.
    • Exit-intent pop-ups and surveys to capture last-minute objections and uncertainties.
    • Live chat and chatbots to proactively intervene when shoppers are wavering.

    By continuously monitoring, testing, and optimizing your site’s trust experience, you’ll be able to plug leaks in your conversion funnel and create a smoother path to purchase.

    Learn more: How to Optimize Your Checkout to Reduce Abandoned Carts

    Final Takeaways: More Trust, More Revenue

    Trust isn’t a nice-to-have – it’s a revenue multiplier. The brands that actively eliminate doubt at every step of the journey turn abandoned carts into conversions and one-time buyers into repeat customers.

    But here’s the key: trust isn’t just about the checkout page. It’s built (or lost) long before a shopper reaches the cart and continues well after they’ve made a purchase. 

    Every touchpoint – your homepage, product pages, customer reviews, checkout flow, and post-purchase experience – either reinforces confidence or creates friction.

    The brands that win don’t just optimize for conversions. They optimize for trust at every stage. Do that, and you’re not just closing more sales… you’re building a brand customers believe in, come back to, and tell their friends about.

  • Top Reasons for Cart Abandonment on Ecommerce Sites (And How to Avoid)

    Top Reasons for Cart Abandonment on Ecommerce Sites (And How to Avoid)

    You can burn yourself out trying to understand why your shoppers leave without completing their purchase, leaving their cart abandoned. You ask yourself, is there something wrong with my product? Do visitors feel like they can’t trust my brand? Or does my website have a problem?

    You’re not alone in this battle. Data shows that for all ecommerce businesses, the shopping cart abandonment rate is around 70.19%. This means that only 3 out of 10 visitors will convert!

    To help you with that, in this article, I’ll go over the most common reasons for cart abandonment on ecommerce stores, giving you the knowledge you need to optimize your checkout and increase conversions and revenue.

    The 11 Most Common Top Cart Abandonment Reasons

    Lowering the cart abandonment rate on your site is one of the quickest and easiest ways to boost revenue. These people are already on your site, they’re showing a clear interest in your products, yet something is holding them back from becoming paying customers.

    To fix this, we need to understand why these shoppers are leaving without checking out. Luckily there’s a wealth of data and experience we can take and learn from.

    Here are ten common cart abandonment reasons, and some insights on what you can do to avoid them.

    1. Unexpected Additional Costs

    Unexpected costs, like taxes, shipping, and other fees, are some of the top reasons for cart abandonment because they make the customer rethink their purchase. No one likes getting to the end of a checkout flow only to find a higher total amount than expected.

    In ecommerce, price is an important factor for buyers. Especially when you consider that comparing prices among competitors is very easy. You can simply screenshot a product image and search for it using a Google Image search.

    There, you will see all the stores and retailers that offer the same product, each with its own pricing range.

    Nowadays, customers like to compare options and costs, until they come to a final decision. So any additional costs they didn’t consider beforehand will disappoint or irritate them. The biggest downside to that isn’t only losing sales, but leaving visitors with a negative opinion of your business.

    2. Limited Shipping Options

    Delivery is a crucial part of the ecommerce experience. Customers expect convenient shipping options that suit their needs and offer on-time delivery. Letting them personalize delivery details and choose between shipping providers can reduce shopping cart abandonment and improve your website’s user experience.

    Important purchases for dates like anniversaries and birthdays are often time-constrained, and if your store is unable to deliver the goods on time, customers will be forced to cancel their order.

    And to make it worse, customers are often willing to spend more for quicker deliveries. So make sure to give customers a variety of shipping options—even if you need to charge more for it.

    3. Website Performance Issues

    It’s not news that a poor user experience will lead to high abandonment rates. Technical issues frustrate visitors, and in the worst-case scenario, these issues can erode their trust in your business and put them off ever trying again.

    Issues like slow load speeds, missing content, photos that don’t load correctly, and bugs will drive away customers. And if you don’t identify the UX issue that is causing cart abandonment, you could be losing sales for days, weeks, or even months.

    Oftentimes, changes on a website can have the craziest consequences for other parts of the store. So test and analyze the performance of your checkout regularly to make sure there aren’t any weak points.

    4. Your Website is Poorly Optimized for Mobile

    Taking into consideration that more than 38% of ecommerce sales are mobile in the US, a poor mobile design is definitely one of the top reasons for cart abandonment. And it’s more common than you may think.

    Many stores fail to consider that the shopping and checkout experience can look very different on mobile than on desktop. It’s important to see the user experience from their point of view and understand how user behavior changes by device to reduce cart abandonment.

    There are many tools today that can help you with that, like heat maps and session recordings. With them, you can identify the places on the customers’ journey where users tend to struggle and optimize them to create a user-friendly interface across platforms. 

    5. Overcomplicated, Time-Consuming Checkout Flow

    A long, complex checkout process can easily result in abandoned carts. Ecommerce is built for convenience, and if there are too many hoops to jump through in order to complete a purchase, many customers will simply give up.

    Try to minimize form elements and data entry to make your payment process streamlined and straightforward. It’s tempting to gather contact info to add to your database for remarketing purposes, but it’s not worth losing sales.

    Instead, you should ask only for the necessary information, and always try to justify yourself to your customers. For example, you can say you need the email to send out the payment data later or ask for their birth date for security reasons.

    Any extra data you’d like to collect you can ask for after the purchase is complete—you just need to make sure to offer an interesting deal for customers to be willing to share it with you.

    6. Forcing Customers to Create an Account

    Following the previous line of thought, forcing users to create an account or register to add items to their virtual cart is generally going to reduce conversions. It adds extra friction, and the more friction involved in your checkout flow, the more likely it is that customers will drop off.

    To increase conversions, you can offer guest checkout, speeding up the process, and auto-save options so they can have their personal information completed automatically even without an account.

    7. Lack of Trust

    Buying from an unfamiliar ecommerce brand is scary, especially when it comes time to type in your credit card details.

    Customers will only provide their credit card details after you’ve earned their trust. And it goes beyond financial data: today, personal information protection is a growing concern among users.

    There are many signals your visitors will look for to decipher if you’re trustworthy: a well-known brand, SSL certificates, clear return policies, user reviews, and other signs that you’re a brand that they can trust.

    Want to know one of the most underrated trust and authority signals for ecommerce stores? A mobile app.

    Those “Available on the App Store” badges instantly add credibility to your website and can increase conversions all on their own.

    Click here to learn how you can turn your store into a mobile app and enter the app stores for a minimal investment, in as little as two weeks.

    8. Lack of Social Proof

    Poor social proof is another of the top reasons for cart abandonment. Especially when it comes to unique goods or ones that have a higher price range.

    In these cases, customers need a last push to be convinced that your product is worth it. Reviews, star ratings, and a clear description of the product’s unique value can make visitors go beyond the ‘adding to cart’.

    Another popular resource today is adding User Generated Content. Besides being proof that others have bought your product and benefited from it, UGC allows visitors to see it in action and understand how it differentiates from the competition.

    9. Lack of Payment Options

    Most people have a preferred way to pay when shopping online, beyond the standard Visa/Mastercard.

    This includes payment methods like PayPal, mobile shopping wallets (e.g. Google Pay, Apple Pay), and Buy Now Pay Later services.

    The more options you offer, the less likely it is that you’ll lose a sale because you don’t offer someone’s preferred method of payment.

    Make sure you consider your ideal customer profile, and think about how that kind of person is likely to pay for things online.

    For example, NewEgg, a leading ecommerce store for computer parts, lets its customers pay with cryptocurrency.

    10. Visitors Are Just Browsing

    Keep in mind that many of your site visitors don’t actually have the intention of making a purchase.

    It’s free to look around. These people may even add products to their cart and peek at the checkout to see what the final price will be, what shipping options are available, etc.

    You can see this as an opportunity to turn some of these visitors into repeat customers.

    For instance, you can set up a wish list or ‘save for later’ option to prevent people from adding items to their cart when they’re just browsing. This will also give you interesting insights into your audience, which you can build up and use as part of your remarketing efforts.

    11. Waiting for a Discount Email

    Abandoned cart emails are common practice today, and there will be crafty shoppers who know that if they leave without checking out, the store is likely to contact them with a sweetener to help them complete their purchase.

    Are these people trying to game the system? Perhaps, but it also shows how effective abandoned cart follow-ups are.

    Consider this as part of your customer acquisition cost – if you can fit it into your margins, a follow-up with an additional discount will convert a lot of would-be abandoned carts into purchases.

    How to Help Abandoned Carts Find Their Way Home

    So we have a better understanding of why people leave their carts abandoned. But what can you do about it?

    Start by ensuring you provide a smooth, user-friendly shopping experience, optimized for mobile, with as little unnecessary friction as possible in the checkout process.

    Make sure your site looks trustworthy, with social proof and UGC to back it up.

    But most abandoned carts aren’t because of usability or trust issues. They’re simply people who forgot to check out, got distracted, or got cold feet.

    You can re-engage a lot of these shoppers and get them to follow through with a simple follow-up message.

    Abandoned cart emails are one easy and effective way to follow up. But abandoned cart push notifications are even better.

    Push notifications are cheap, personal and direct. If you follow up with every abandoned cart with a push notification reminding them that their cart is still there, ready to be paid for, you’ll almost certainly recapture some of those lost sales.

    For push notifications to work, you need a mobile app. An app lets you send native mobile push notifications on all operating systems, and gives you extensive options for customization and building personalized push workflows.

    Vendrux makes it easy for you to create an app for your site. You can go live in as little as two weeks, for a minimal cost, with no coding or technical knowledge required.

    Ecommerce apps built with Vendrux

    We do everything for you, simply converting your existing website into high-quality mobile apps. It’s as risk-free as it gets.

    If you want to hear more about how some of our clients deal with the top reasons for cart abandonment, take a look at some of our case studies –  a small collection of the 2,000+ businesses who used Vendrux to convert their website to mobile apps.

    Launch Your Own App and Reduce Abandoned Carts Today

    Following up with abandoned carts via push notifications and emails will easily help you recapture lost revenue.

    An app gives you the best way to do this, as well as providing a more optimized mobile shopping experience, free from the distractions of other browser tabs, which will help boost conversion rate too.

    You can boost average order value, increase abandoned cart recovery, and boost revenue in a number of ways. With the low cost and overhead that comes when you build an app with Vendrux, it’s hard to see a scenario where you don’t get a positive ROI.

    Get a free preview of your app and learn how you can elevate your store to new heights.

  • The Top Ecommerce Categories Fueling US Online Shopping Growth

    The Top Ecommerce Categories Fueling US Online Shopping Growth

    In this article we’ll share the latest data on the top eCommerce categories in the United States.

    By the end, you’ll have a firmer knowledge of the consumer habits of online shoppers; knowledge you can use to grow your own eCommerce business.

    Along with the top online shopping categories, we’ll show you which product categories are trending up or down, how the top categories differ in other countries and which are particularly popular online compared to physical retail.

    Want weekly insights into how 7, 8 and 9-figure brands are driving sustainable growth? That’s what you get with our value-packed newsletter, The Retention Edge. Subscribe for free today.

    What is the Top Online Shopping Category in the US?

    According to data from eMarketer, the top online shopping category in the US is the Computer and consumer electronics category, which is responsible for $219.33 billion in retail eCommerce sales over the last year.

    This makes up 21.2% of all retail eCommerce sales in the US.

    All those iPhones, AirPods, Samsung Galaxies, Smart Watches and Smart TVs add up. With the price tag on all the latest electronics, it’s no surprise that this is the product category responsible for 1 in 5 dollars spent in the US eCommerce industry.

    The Nine Top Online Shopping Categories in the US (By Revenue)

    Let’s round out the full list of the top online shopping categories in the US.

    1. Computer and consumer electronics: $219.33 billion (21.2% of total sales in the US market)
    2. Apparel and accessories: $203.75 billion (19.7%)
    3. Furniture and home furnishings: $129.45 billion (12.5%)
    4. Health and personal care and beauty: $111.03 billion (10.7%)
    5. Auto and parts : $86.26 billion (8.3%)
    6. Food and beverage: $78.28 billion (7.6%)
    7. Toys and hobby: $74.03 billion (7.2%)
    8. Books/music/video: $54.02 billion (5.2%)
    9. Office equipment and supplies: $19.35 billion (1.9%)

    All other product categories account for $58.32 billion in revenue (5.6% of the total retail eCommerce market).

    E-Commerce Categories: Rising vs Falling

    Which product categories are on the way up, and which are in decline?

    Trick question – all of the top online shopping categories are increasing year over year. The US eCommerce market as a whole grew by 14.1% in 2022, which means there was plenty of growth to go around.

    The fastest growing eCommerce category is Auto and parts, which grew 30.1% YoY in 2022.

    Only sales in “other” categories declined by 4.5%. The other nine categories above all saw positive growth.

    Some categories did grow more than others. And using the total market growth as a benchmark, we can pinpoint which categories are rising or falling relative to other top eCommerce categories.

    Rising

    The following categories are growing faster than the eCommerce market as a whole, meaning they’re increasing in market share, with more people choosing to shop online for products in these categories.

    • Auto and parts (30.10% growth vs 14.1% total eCommerce growth)
    • Food and beverage (20.70%)
    • Apparel and accessories (15.40%)
    • Health and personal care and beauty (15.10%)
    • Computer and consumer electronics (15.00%)

    Falling

    These categories are still growing, but at a slower rate, meaning their market share is decreasing.

    • Office equipment and supplies (14.00%)
    • Toys and hobby (12.00%)
    • Furniture and home furnishings (10.30%)
    • Books/music/video (8.40%)

    Projections

    Total eCommerce growth YoY for this year is projected to be 13.8% – slightly less than the year before.

    This is broken down into the following numbers for each of the most popular categories:

    • Auto and parts : 22.70%
    • Food and beverage: 19.60%
    • Health and personal care and beauty: 14.70%
    • Apparel and accessories: 14.60%
    • Computer and consumer electronics: 14.10%
    • Office equipment and supplies: 13.60%
    • Toys and hobby: 11.40%
    • Books/music/video: 9.90%
    • Furniture and home furnishings: 9.30%
    • Other: 4.10%

    Overall eCommerce growth is expected to slow to 12.1% by 2026. This is understandable, as eCommerce by now is already a fixture in our lives, leaving less room for growth every year.

    Instead, expect mobile commerce to rise over the coming years as one of the hottest new trends in the retail industry. Each year, more products purchased online are purchased on mobile devices, as many consumers opt for the increased convenience of mobile (particularly shopping apps).

    Looking to build your own shopping app? Vendrux gives you a way to turn your existing eCommerce store into apps, for minimal lift and expense, with little to no overhead. Click here to learn more.

    eCommerce vs Physical Retail Share for Top Product Categories

    Let’s look at how today’s market is split between eCommerce and physical retail, and where the sales come for the top product categories.

    The total retail market in the US is split largely in the favor of brick and mortar, with 83.2% market share vs eCommerce’s 16.8%.

    With those numbers in mind, you’ll see that many of the top eCommerce categories are significantly above average in terms of eCommerce vs physical market share.

    Categories with Above Average eCommerce Penetration

    These two product categories are particularly popular online, with more than 50% of product sales coming via online shopping:

    • Books/music/video (68.40% eCommerce vs 31.60% physical)
    • Computer and consumer electronics (56.30% eCommerce vs 43.70% physical)

    The following five categories also have a relatively high popularity online. Though each category still has more sales from brick and mortar than online, the share of eCommerce revenue vs physical retail is higher than the overall online vs brick and mortar market share.

    • Toys and hobby (42.40% eCommerce vs 57.60% physical)
    • Office equipment and supplies (39.90% eCommerce vs 60.20% physical)
    • Apparel and accessories (37.00% eCommerce vs 63.00% physical)
    • Furniture and home furnishings (32.60% eCommerce vs 67.40% physical)
    • Health and personal care and beauty (17.20% eCommerce vs 82.80% physical)

    Physical-Dominant Categories

    On the flip side, these categories have a higher than average share of sales in physical retail, showing that relatively few shoppers have made the jump to buying online.

    • Food and beverage (6.40% eCommerce vs 93.60% physical)
    • Auto and parts (5.20% eCommerce vs 94.80% physical)
    • Other (3.60% eCommerce vs 96.40% physical)

    Top Online Shopping Categories Around the World

    Finally, let’s compare the top eCommerce categories worldwide to those in the US.

    The top online shopping categories around the world in terms of total revenue are:

    1. Fashion: $990 billion
    2. Electronics: $910 billion
    3. Toys, hobby and DIY: $780 billion
    4. Beauty, health, personal and household care: $400 billion
    5. Food: $350 billion

    Data from Statista.

    Fashion and electronics are among the top selling product categories both in the US and around the world. Health, personal care and beauty products are also in the top five for both segments.

    Food and Toys/Hobbies are more dominant in worldwide eCommerce than they are in the US, while US shoppers have a higher relative spend on Furniture and Auto products.

    Most Popular Online Shopping Categories

    When we’re talking about the top eCommerce categories, “top” can mean a few different things.

    We’ve mostly been talking about revenue. But another angle is to look at the most popular product categories – the kind of products that people buy most often.

    According to data from Statista, the most popular category worldwide is Clothing, with 57% of internet users responding that they’ve bought a product online in this category in the last 12 months.

    This is followed by Shoes, Consumer electronics, Books, Movies & Games, and Cosmetics & body care.

    Here’s the full list of the most popular online shopping categories worldwide with their purchase reach (percentage of internet users who have made a purchase in this category in the last 12 months)

    • Clothing: 57% purchase reach
    • Shoes: 47%
    • Consumer electronics: 40%
    • Books, movies, music & games: 36%
    • Cosmetics & body care: 32%
    • Bags & accessories: 29%
    • Food & drinks: 28%
    • Household appliances: 27%
    • Furniture & household goods: 19%
    • Sports & outdoor: 18%
    • Toys & baby products: 18%
    • Stationary & hobby supplies: 17%
    • DIY, garden & pets: 13%

    Clothing and Shoes are the two categories with the highest purchase reach in the US as well, with 44% and 34% reach respectively.

    In Summary

    The results are in; fashion and electronics are the two most dominant online shopping categories, both in the US and around the world. More than 40% of US eCommerce dollars go towards consumer electronics and apparel.

    Electronics are particularly popular with online shoppers, with slightly over half of the money spent in this category spent online; much higher than the overall online shopping market share of 16.8%.

    Both the top product categories are growing at rates in line with the overall growth of the US eCommerce market (13.8%). Auto and parts and Food and beverage are the fastest growing online shopping categories in the US, while Furniture and home furnishings and Books/music/video are those with the lowest growth (still positive, but below the overall market growth).

    At Vendrux, we’ve observed similar trends in our work with eCommerce brands, located in the US and around the world.

    We help these brands turn their successful eCommerce websites into mobile apps for a minimal expense and time investment. This is perfect for any business wanting to capitalize on the growth in popularity of mobile commerce, as the likes of Rainbow Apparel and John Varvatos have done.

    The John Varvatos app, built with Vendrux

    If you’re running an online store, you should definitely think about building your own app. You’ll be surprised at how easy and affordable it is to grow your business by entering the app stores, communicating with customers via push notifications and providing a contained, optimized mobile user experience.

    Get started with a free preview of your app when you schedule a free, personalized demo. We’ll show you how it works, and help you take the first steps to entering the eCommerce app market.

  • The Three Types of Push Notifications (And How to Balance Them Correctly)

    The Three Types of Push Notifications (And How to Balance Them Correctly)

    Push notifications are one of the most powerful communication tools for DTC ecommerce brands. They’re a high-visibility, zero-cost-per-send channel (more immediate than email and less intrusive than SMS). 

    But most brands get their push strategy wrong.

    They bombard customers with endless promotional blasts, driving opt-outs, uninstalls, and frustration. When used the right way, however, push notifications can drive long-term retention, build brand awareness, and boost sales… without alienating your audience.

    The key? Understanding, and balancing, the three core types of push notifications: Customer Experience (CX), Promotional, and Awareness.

    Let’s dive deeper, and help you build a push strategy that drives more revenue and fewer opt-outs.

    Want the latest insights into how 8 and 9-figure brands drive sustainable growth? Check out our weekly newsletter, The Retention Edge. Subscribe for free today.

    Why Push Notifications Matter More Than Ever

    Push notifications are a uniquely valuable channel:

    • Zero cost per send, unlike SMS which can cost 1-5 cents per message.
    • Higher visibility than email (appearing directly on lock screens).
    • Less intrusive than SMS (which many customers consider reserved for friends and family).
    • Immediate delivery that email can’t match.
    • Direct access to your most engaged customers (app users represent your most loyal segment).

    Given these advantages, why do so many brands struggle with their push strategies?

    Some brands claim that push (or apps, as a whole) are ineffective.

    But with the results we’re seeing from many brands using push, that’s just not true.

    The answer lies in how you’re utilizing (and balancing) different types of push notifications.

    Further Reading: The Economics of Push Notifications for DTC Brands

    The Three Types of Push Notifications

    All push notifications you send fall into one of three types.

    Most brands send too much of one type, which causes customers to ignore them, and eventually either turn off notifications, or uninstall the app altogether.

    Let’s take a closer look at each type now.

    1. Customer Experience Notifications

    These notifications reduce friction in the customer journey and provide essential updates that improve the buying experience (usually triggered by a specific event, such a purchase).

    Examples:

    • “Your order has shipped! Tap here to track your delivery.”
    • “Good news! The ‘Everyday Tote’ you’ve been waiting for is back in stock. Only 15 available.”
    • “Your subscription will renew in 3 days. Tap to modify or skip.”
    • “We’ve saved your cart! Don’t miss out on the 3 items you were considering.”
    __wf_reserved_inherit

    Why They Matter:

    • Customers expect these notifications, making them the least likely to trigger opt-outs.
    • They build trust and reduce anxiety in the buying process.

    Some CX notifications—like back-in-stock reminders and abandoned cart notifications—have exceptionally high conversion rates (20%+).

    However, many CX notifications are not meant to directly drive revenue. Notifications like shipping updates and order confirmations build the foundation for long-term customer retention, by building a customer experience that increases the chance of the customer buying again.

    Best Practices:

    • Automate these notifications as much as possible
    • Include actionable information, not just status updates
    • Personalize with product names, order numbers, and customer names
    • Time them appropriately (nobody wants a shipping update at 3 AM)

    2. Promotional Notifications

    Promotional push notifications are made to generate immediate sales by sharing offers, product launches, or time-sensitive promotions.

    Examples:

    • “24-HOUR FLASH SALE: 30% off our best sellers ends at midnight. Shop now!”
    • “Early access for VIPs only: Summer collection just dropped. Shop before it’s public.”
    • “Last chance! Your cart items are selling fast.”
    • “BFCM exclusive: Buy one, get one free on all skincare. Today only.”
    __wf_reserved_inherit

    Why They Matter:

    • High conversion potential, especially for engaged users (which most app users are).
    • Useful for urgency-driven promotions (e.g., BFCM, limited-time offers).
    • Typically have a higher conversion rate than email due to their immediacy and high visibility.

    Promotional notifications are a double-edged sword: They deliver the highest short-term ROI but also the highest unsubscribe rates when overused.

    If you only ever send promotional notifications (especially if you send them a lot), you’ll build push fatigue. Users will start to tune out your messages—or worse, they’ll get annoyed, and turn off notifications, or uninstall the app altogether.

    These notifications can be incredibly effective. But only if you manage the frequency with which they’re sent (and the mix of promotional notifications, and the third type, which we’ll discuss next).

    Best Practices:

    • Limit frequency to 1-2 promotional pushes per week maximum
    • Segment and personalize based on purchase history and interests
    • Reserve for truly compelling offers (not every small discount deserves a push)
    • Use sparingly during key selling periods (BFCM, seasonal peaks)

    3. Awareness Notifications

    “Awareness” notifications are the type of push notifications sent the most by the brands with the most impactful push strategies.

    They maintain consistent mindshare without being overtly promotional, creating multiple touchpoints that feel helpful rather than intrusive.

    Examples:

    • “Pro tip: Store your coffee beans in a cool, dark place to maintain freshness longer.”
    • “Happy Self-Care Sunday! Have you done your skincare routine today?”
    • “We love seeing your creative projects! Tag us in your photos using #BrandName.”
    • “Did you know? Your recent purchase helped us plant 5 trees. Learn more about our sustainability efforts.”
    __wf_reserved_inherit

    Why They Matter:

    • Builds long-term familiarity with your brand without annoying customers.
    • Unlike promotional messages, these increase engagement over time, making customers more receptive to future notifications.
    • Push notifications are cheap and high visibility, making them ideal for this approach—unlike SMS (too intrusive, high cost per send) and email (lower visibility and open rates).

    These notifications rarely get credit for conversions in attribution models, but they dramatically increase the effectiveness of your promotional messages (and overall push strategy) over time.

    They keep your brand top of mind, and train your customers to expect regular push notifications, without becoming an annoyance.

    They won’t (and don’t need to) always generate a reaction. But by sending less-pushy push notifications, you can send more, and ultimately drive more long-term engagement.

    These notifications act like a billboard or a display ad on your customer’s lock screen—not meant to drive immediate conversions but to build consistent mindshare.

    Best Practices:

    • Focus on education, community, or brand storytelling
    • Time them for moments when customers are likely to engage with your product category
    • Keep them brief, friendly, and conversational
    • Use them as daily touchpoints rather than conversion drivers

    Further reading: Do Push Notifications Work for Abandoned Carts?

    Finding Your Perfect Notification Balance

    Most brands make a critical mistake: they send almost exclusively promotional notifications, with some basic CX messages when necessary. 

    This approach might drive short-term revenue and decent per-message performance, but burns your list, and the chance to build powerful long-term relationships with a lot of your customers.

    The ideal push notification mix for sustainable growth is something like the following:

    • 70% Awareness notifications (builds long-term retention & brand recall)
    • 30% Promotional notifications (drives immediate revenue)
    • CX notifications when needed (these are typically event-driven)

    The Psychology Behind Why This Balance Works

    When customers only receive promotional messages, they become conditioned to either:

    • Ignore your notifications entirely.
    • Only engage when they’re in buying mode.
    • Unsubscribe to reduce notification noise.

    However, when awareness messages dominate your strategy:

    • Customers see value beyond discounts.
    • Your brand maintains presence without purchase pressure.
    • When promotional messages do arrive, they stand out and receive attention.
    • The perceived value of your app increases beyond just transactions.

    Key takeaway? Think display ads, not megaphones. Push notifications should feel like frequent, low-friction brand impressions that blend into your customer’s day.

    It may feel like you’re getting worse results, because the overall conversion rate is lower.

    But long-term, you’ll get more of what actually matters; repeat customers, LTV, and engaged app users supporting your brand.

    If you don’t have a mobile app yet to send push notifications, make this your priority.

    As long as you have a mobile-optimized website, you’re closer to having an app than you think. It’s fast, straightforward and affordable to turn your website into an app and unlock the benefits of push notifications.

    To see for yourself how easy it is, get a free preview of your site as an app, using just your website’s URL and a few details about your store.

    Final Thoughts: Treat Push Like an Always-On, Low-Cost Display Ad

    Unlike email or SMS, push notifications are essentially free, with high visibility.

    They don’t even need to be opened; customers get the entire message right there on their lock screen (which the average American looks at 262 times per day).

    Instead of treating push as just another promotional tool, use them to build brand familiarity and long-term engagement. Think of them as organic, native, high-frequency brand impressions.

    Brands that only send promos burn through their list. Smart brands mix in awareness & CX messages to extend the life of their push strategy and maximize retention.

    Actionable Next Steps:

    1. Audit your current push strategy—what’s the mix of CX, promo, and awareness?
    2. Build a push notification calendar balancing all three types.
    3. Test sending more awareness notifications and track engagement (overall app engagement—not just direct results such as CTRs and conversion rate from push) over 90 days.

    Remember that the goal is not necessarily to sell from every push. 

    People don’t swerve off the highway to get to a grocery store whenever they see a coke billboard. But the next time they are in a grocery store, they’re drawn to the Coca Cola display.

    If you craft your push mix correctly, you should see more sessions, higher session time, and more revenue from your app users.

    The best brands don’t just sell. They stay in their customers’ minds. Use push notifications to do both.

  • 39 Shopify Statistics (Revenue, Merchants, Customers and More)

    39 Shopify Statistics (Revenue, Merchants, Customers and More)

    Shopify – you’ve probably heard of it.

    Just ten or so years ago, very few had. Yet now, this platform is behind around a quarter of all eCommerce websites, including more than 2.8 million in the US alone.

    It’s easy to argue that Shopify is largely responsible for the boom in eCommerce in the 21st century. Shopify was one of the first platforms to make it easy for anyone to launch an online store, without needing web development skills or a team of developers.

    In this article we dive deep into data behind the Shopify platform, with the most interesting and insightful Shopify Statistics and Shopify Facts to know about in 2026.

    Shopify Statistics: Highlights

    • There are more than 4.8 million currently live Shopify websites, and more than 7.3 million total websites that have used Shopify at some point.
    • Roughly 60% of Shopify websites are US-based, with more than 2.9 million sites.
    • Shopify processes more than $500 billion in GMV yearly, with 561 million unique customers coming through Shopify-powered stores.
    • Shopify has 26% of the eCommerce platform market share, making it the most popular technology for eCommerce websites today.
    • Shopify is also the third most popular online payment processing technology, behind PayPal and Stripe.

    Shopify User & Merchant Statistics

    In this article we’ll be breaking down our Shopify statistics by a few different categories. The first is Shopify statistics regarding Shopify users; merchants and online stores that use Shopify to power their businesses.

    In this section, we find that Shopify powers nearly 5 million websites worldwide. Most of these are in the US; in fact, the next most popular country for Shopify stores, the UK, has only 200,000 live websites, less than 5% of all Shopify stores.

    Nearly 25% of Shopify stores are in the Apparel category, with Home & Garden second at approximately 10%.

    In total, Shopify stores combine to drive over half a trillion – $500 billion – in GMV per year.

    Based on this figure, and depending on which source you take for the total number of Shopify stores, the average Shopify store’s revenue is between $104,000 – $235,000 per year, or $8,666 – $ 19,583 per month.

    Here are all the Shopify user statistics you need to know about:

    • More than 7.3 million websites have used Shopify at some point, with more than 4.8 million live websites using Shopify.
    • Shopify supports businesses in over 175 countries.
    • There are 2.9 million websites running on Shopify in the US, which accounts for 60% of all Shopify stores.
    • The next most popular country for Shopify users is the UK, with 200,000 sites, 4.26% of all Shopify sites.
    • The most popular product category for Shopify stores is Apparel, accounting for nearly 25% of all Shopify stores.
    • Shopify processed more than half a trillion dollars in GMV in 2022.
    • The average Shopify store does between $104,000 – $235,000 in yearly GMV.
    • Shopify Merchants around the world drove $9.3 billion in sales for Black Friday-Cyber Monday (BFCM) weekend in 2023, an increase of 24% on the previous year.

    Sources: BuiltWith | Shopify [1] [2] [3] | Statista

    Shopify Customer Statistics

    Now let’s look at customers – people who buy from Shopify-powered websites.

    Many of these consumers don’t know anything about the Shopify name or brand. All they know is the name of the website they’re buying from. And Shopify gives these brands the tools to provide an excellent user experience.

    For the millions of Shopify users, there are multitudes more who are buyers from Shopify-powered websites, 561 million, in fact, who came through Shopify stores in 2022 alone.

    During Black Friday-Cyber Monday in 2023, Shopify sites served 61 million shoppers, who spent an average of $108.12 in each transaction.

    This comes out a little higher than the average order value for Shopify stores, which came out at $85 per one study, with the average revenue per customer on Shopify sites at $92.

    The final point to note is that more and more customers are mobile first; mobile made up 69% of online sales on Shopify stores during a recent BFCM weekend.

    • 561 million unique online shoppers came through Shopify-powered stores in 2022.
    • 61 million consumers purchased from Shopify brands during BFCM 2023, with an average cart price of $108.12.
    • A 2022 study by LittleData found that the average order value (AOV) for Shopify stores was $85, with 60% of stores between $50 and $192 in AOV.
    • The same study found that Shopify stores have an average revenue per customer of $92, with 60% of stores between $53 and $209.
    • Mobile accounted for 69% of all online sales for Shopify Merchants during Black Friday-Cyber Monday 2022.

    Sources: Shopify [1] [2] [3] | Littledata [1] [2

    Shopify Market Share

    Shopify has carved out a space as the most popular platform for eCommerce businesses to build their website on.

    More than a quarter of all eCommerce websites run on Shopify. Including Shopify Plus, Shopify’s enterprise solution, they are also the market leader among the highest-traffic eCommerce websites in the world.

    • Shopify holds 26% market share among all eCommerce websites, beating out WooCommerce as the #2 eCommerce platform.
    • Among the top 1 million eCommerce websites by traffic, Shopify (including Shopify Plus) has 27% market share.
    • Shopify (including Shopify Plus) makes up 21% of the top 10,000 eCommerce websites by traffic in the world.

    Sources: BuiltWith [1] [2] [3]

    Shopify Revenue

    Earlier we showed you how much the average Shopify-powered website made in yearly/monthly revenue. Now we look at Shopify, the business.

    As you’d expect from the software powering nearly 5 million websites around the world, Shopify has established itself as an extremely valuable company. They do this through a number of avenues, including monthly subscription fees and taking a flat percentage fee from each transaction facilitated by Shopify merchants.

    • Worldwide, Shopify generates over $5.6 billion in total revenue yearly, an increase of more than $4 billion since 2015.
    • Shopify has a Monthly Recurring Revenue (MRR) of $107 million (revenue from subscriptions, not including transaction fees).

    Sources: Statista | Shopify

    Shopify Plus Statistics

    One of the fastest-growing elements of Shopify’s business is Shopify Plus. Shopify Plus supports enterprise-level brands, providing a scalable platform with increased security, deeper reporting and the ability to support higher transaction load and unlimited SKUs.

    Shopify Plus now powers nearly 50,000 websites around the world, the majority of which are based in the US. These include some of the world’s biggest brands and names, from Gymshark to Nestle to Eminem.

    • 48,000 websites currently run on Shopify Plus.
    • 27,000 of these websites are based in the US, making up 56% of all Shopify Plus stores.
    • Next highest countries by Shopify Plus usage are the UK (3,316 sites, 6.85% of total) and Australia (3,046 sites, 6.29%).
    • The average Shopify Plus store is built and launched within 90 days.
    • Shopify Plus merchants include Rebecca Minkoff, LeSportSac, Fashion Nova, Gymshark, Hawkers, Leesa, GE, Nestle, and Unilever and businesses from celebrity entrepreneurs Kylie Jenner, Eminem, Justin Bieber, and Kanye West.

    Sources: BuiltWith | Shopify

    Shopify App Store Statistics

    One reason Shopify is such a popular platform for eCommerce businesses is the vast ecosystem of third-party apps, plugins, integrations and service providers.

    Many of these come through the Shopify App Store, which has become one of the best ways for developers to earn a living building B2B software.

    The App Store features more than 11,000 apps, from more than 7,000 developers, who average nearly $100,000 per year in revenue.

    All up, Shopify app developers have earned more than a billion dollars over the App Store’s lifetime.

    • There are more than 11,000 apps in the Shopify App Store, from over 7,000 vendors.
    • 87% of Shopify merchants use apps from the App Store.
    • The average cost of a Shopify App is $19.14.
    • The average merchant spends approximately $120 per month on Shopify Apps.
    • The average Shopify App developer earns $93,000 per year in revenue, while the top 25% of Shopify App developers make revenue of around $167,000 per year.
    • Shopify App partners and developers have earned more than $1.5 billion since the Shopify App Store was launched.

    Sources: Store Leads | Shopify Theme Detector | Shopify

    More Shopify Facts & Statistics

    Wait – we’re not finished. Here are some more insightful Shopify facts and statistics that are sure to rouse your curiosity.

    Data shows that Shopify sites convert more than sites built on other platforms, and the scale at which Shopify processes transactions makes it one of the most popular payment processing technologies in the world.

    Then there’s the Shop App; Shopify’s customer-facing app, where consumers can shop from different brands running on Shopify, all in one place. This app has quietly become one of top 5 shopping apps in the world today.

    Here’s more to round out the article:

    • Shopify is the third most popular online payment processing technology today, with 14% market share, behind only PayPal and Stripe.
    • Shopify claims that Shopify checkouts convert 72% better than the average eCommerce checkout.
    • Shop Pay increases conversions by as much as 50% compared to guest checkout 
    • A study from a Big Three global consulting firm found Shopify Checkout converts 36% better overall and 15% better on average than other eCommerce platforms, including Salesforce Commerce Cloud, Magento and BigCommerce.
    • Shopify Payments currently supports merchants in 23 countries.
    • The Shopify Admin interface is available in 21 languages, from English to Czech, Thai, Norwegian and Vietnamese.
    • Shopify’s customer-facing Shop App has over 24 million total users.
    • The Shop App has over 10 million downloads and 514000 reviews on Google Play. 
    • The Shop App has more than 4.7 million ratings on the Apple App Store, and is ranked the #5 ranked shopping app for iOS.
    • 98% of orders delivered with Shopify Fulfillment are delivered on time in three days or less.
    • There are more than 760 Shopify service partners across the US, UK, Canada and Australia.

    Sources: Statista | Shopify [1] [2] [3] [4] [5] [6] [7] | Google Play | Apple

    Wrapping Up

    Doing more than $5 billion in yearly revenue, supporting more than a quarter of the world’s eCommerce websites and facilitating over $500 billion in yearly revenue, Shopify is without a doubt one of the biggest tech companies in the world today.

    The data in this article backs this up, and gives a look under the hood at how Shopify fits into (and in a large part, creates) the modern eCommerce ecosystem.

    If you’re a Shopify store owner, you’re on the right track by using Shopify as the tech stack to power your website. Your next step, to keep up with the rising wave that is mobile commerce, should be to launch your own app.

    That’s what Vendrux does for you. We’re the #1 way for eCommerce businesses (especially Shopify stores) to create a branded mobile app. We provide a full service that makes it easy, requires no foreknowledge of coding or mobile development, and is affordable for any store with consistent revenue.

    Learn more with the following resources:

    Building an app with Vendrux is the best way to increase your revenue and build a bigger Shopify brand, without adding huge amounts of overhead or complexity to your business. Get started with a free preview of your app, get in touch now and let’s talk.