Vendrux allows you to inject parameters into all URLs loaded in your app to track app usage through UTMs in Google Analytics without needing extra configuration.
To enable this feature, edit the app’s advanced configuration by adding the following parameters:
Under the "Parameter" key, specify the string to be appended to all URLs loaded in the app. We recommend using UTM parameters for seamless tracking by Google Analytics, but you can use any parameters as needed.
The parameters will be appended to the final URLs even if there is a redirect, and the app will ensure that the URL structure remains intact if it already contains parameters.
Exclusion Rules
Exclusion rules allow you to specify which URLs should not have the parameters appended. These rules use Regex to match URLs. If a URL matches the Regex pattern, the parameters will not be injected.
Here are a few examples:
Matches all URLs that are different from vendrux.com
If you are using Google Tag Manager (GTM) on your website, check our Google Analytics with Google Tag Manager guide instead.
Tracking the performance of your app is key to make sure your goals are achieved, in this guide you will learn how to adjust your website Google Analytics integration to allow you to track your app separately from your website.
Configure Google Analytics Tracking Code
Your existing Google Analytics tracking code should look like this:
    window.dataLayer = window.dataLayer || [];
    function gtag(){dataLayer.push(arguments);}
    gtag('js', new Date());
    gtag('config', 'G-XXXXXXXXX');
We will add a few lines of code that will add an extra user property to users who view your website through the Vendrux app.
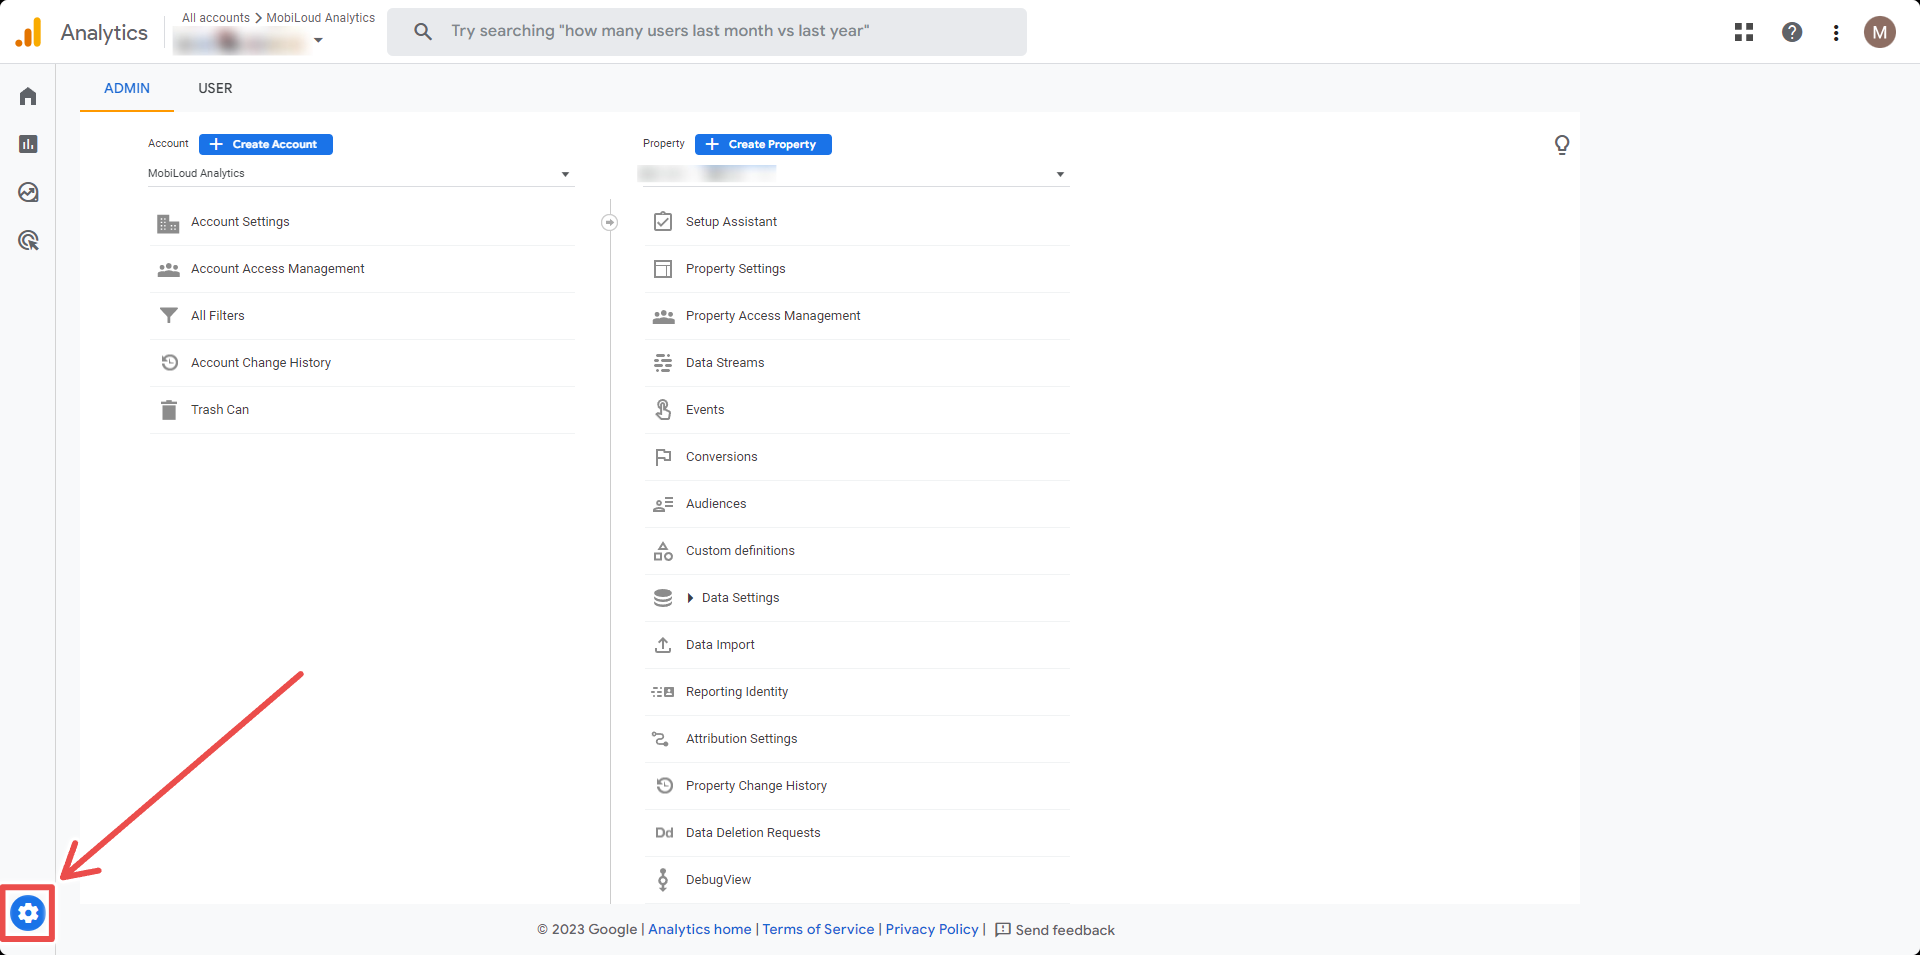
Click the “Gear” icon located on the bottom left area of your screen:
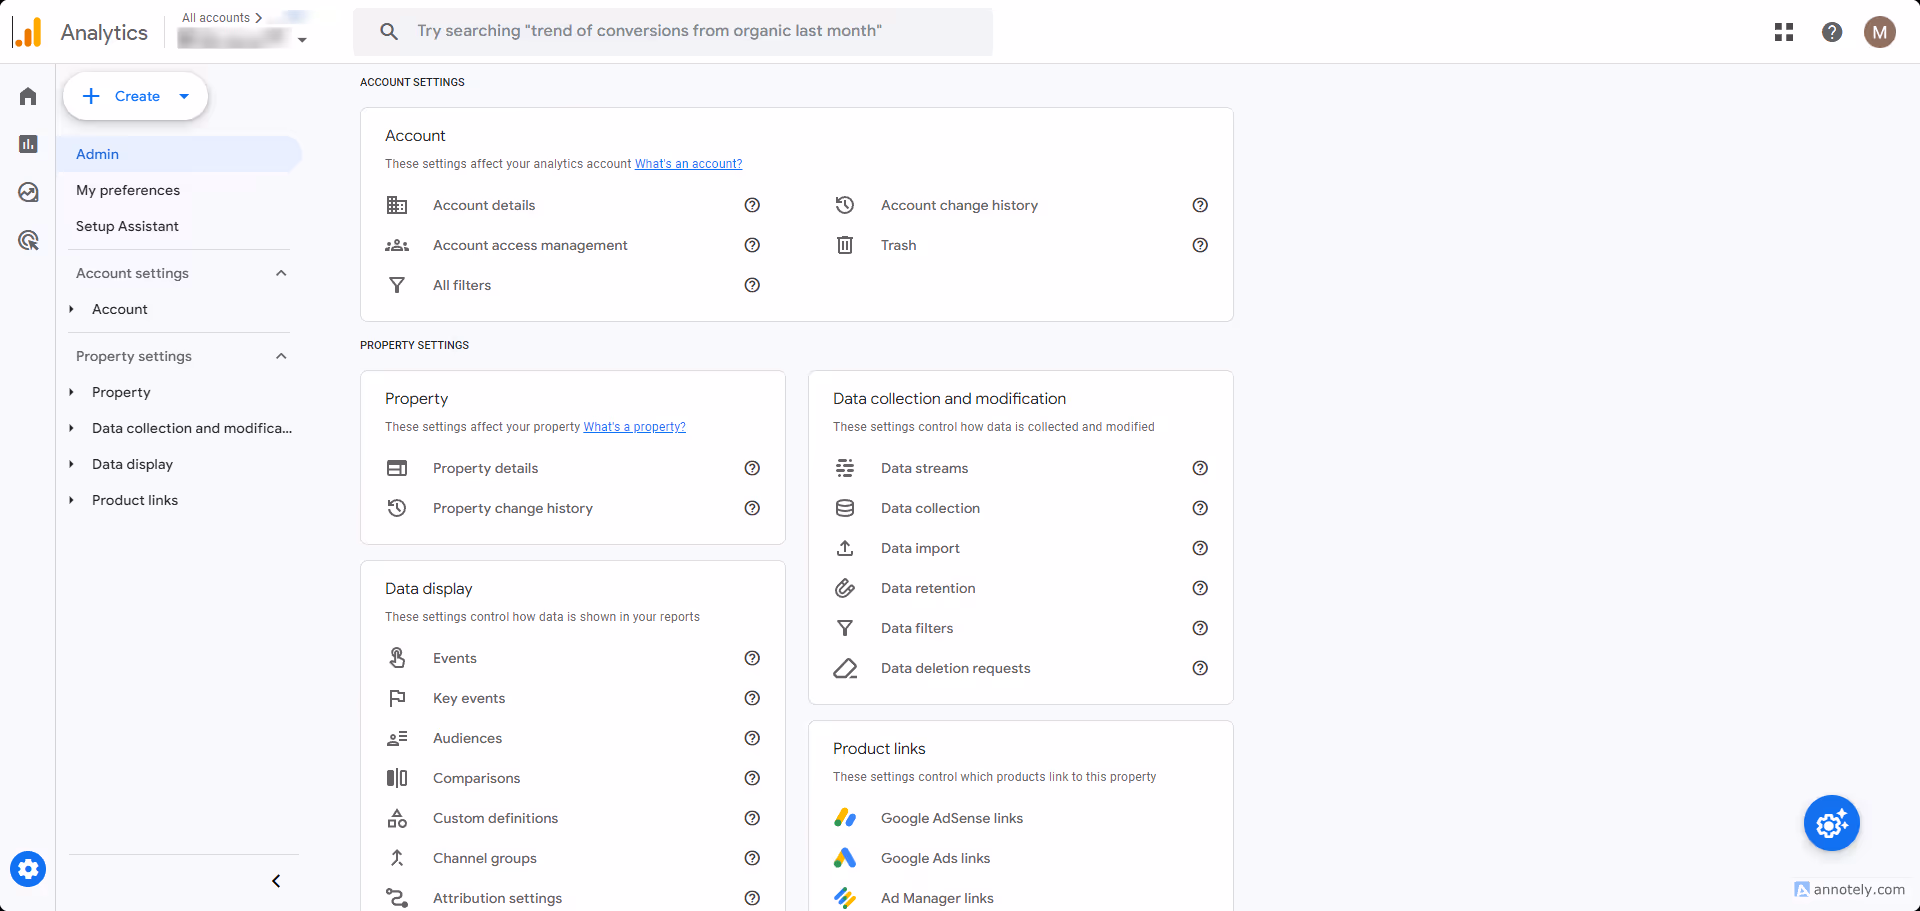
Click “Custom definitions” in the “Property” column:
Click the “Create custom dimension” button:
Fill the details as follows:
Dimension name: app_session
Scope: user
Description: Determines if the user is viewing the website on the browser or through the app
User property: app_session
Save your custom dimension, and you are done!
You Need to Wait
Once you have created the custom dimension you will need to wait until a few users have opened your app, and for the data to be processed by Google Analytics, which usually takes 24 hours at least.
To clarify, you will not be able to see segment your users immediately, you will need to wait 24 hours before doing so.
If you are using Google Tag Manager (GTM) on your website, check our Google Analytics with Google Tag Manager guide instead.
Tracking the performance of your app is key to make sure your goals are achieved, in this guide you will learn how to adjust your website Google Analytics integration to allow you to track your app separately from your website.
Configure Google Analytics Tracking Code
Your existing Google Analytics tracking code should look like this:
    window.dataLayer = window.dataLayer || [];
    function gtag(){dataLayer.push(arguments);}
    gtag('js', new Date());
    gtag('config', 'G-XXXXXXXXX');
We will add a few lines of code that will add an extra user property to users who view your website through the Vendrux app.
Click the “Gear” icon located on the bottom left area of your screen:
Click “Custom definitions” in the “Property” column:
Click the “Create custom dimension” button:
Fill the details as follows:
Dimension name: app_session
Scope: user
Description: Determines if the user is viewing the website on the browser or through the app
User property: app_session
Save your custom dimension, and you are done!
You Need to Wait
Once you have created the custom dimension you will need to wait until a few users have opened your app, and for the data to be processed by Google Analytics, which usually takes 24 hours at least.
To clarify, you will not be able to see segment your users immediately, you will need to wait 24 hours before doing so.
You can track your app users via Google Analytics and Google Tag manager.
In order to do this, you will need to create a custom dimension in Google Analytics, a variable to detect the “canvas” string in the user agent, and a tag to track app users.
Even though this sounds simple enough, there are quite a few things you need to do on both platforms to achieve the desired result.
If you have a popular website, with many users, we’d recommend asking a developer to help you with this, to avoid issues with your Analytics metrics.
Before we start, keep in mind that Vendrux relies on your website for all the content, when a page of your website is displayed in the app, we are simply performing an HTTPS request to it. For that reason, we are going to use the same Google Analytics Property that you use for your website, and it should look like this:
Let’s get started!
Step 1 – Create a custom dimension in Google Analytics
On the left sidebar, open the “Admin” area by clicking the “Gear” icon on the very bottom:
Now select “Custom Definitions” under the “Property” column:
Click the “Create custom dimensions” button on the right side of the screen:
A form will appear on the right side of your screen, and you must fill the fields as follows:
Dimension name: app_session
Description: can be empty
User property: app_session – you will have to type this in
It is important to use the values above, for consistency and to make it easy for our team to help you with troubleshooting. Your form should look like this:
Step 2 – Copy your Web Steam Measurement ID
Before leaving your Google Analytics Dashboard, go to “Admin” on the left sidebar:
Select “Data Streams”:
Select your website’s data stream:
Click the “Copy” button on your Measurement ID, and save the number somewhere on your computer, you will need it later:
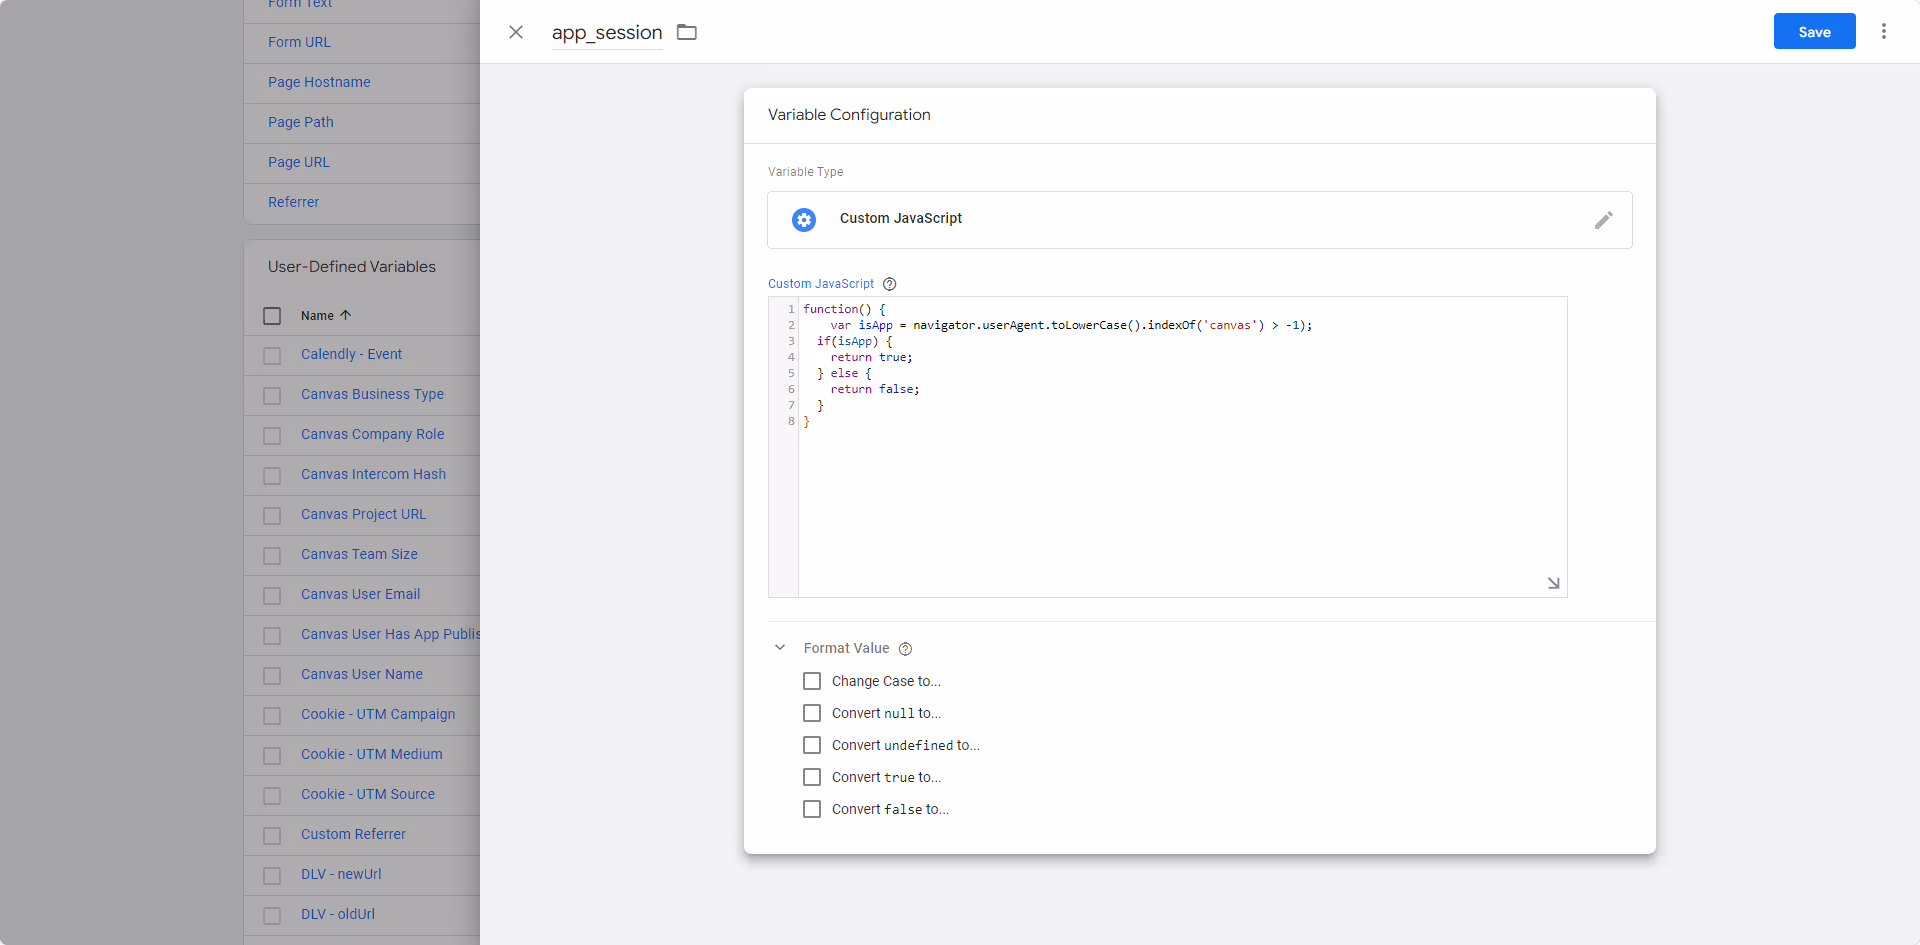
Step 3 – Setup your variable in Google Tag Manager
Note: Please ignore the variable name in the screenshot. Use “Vendrux – Mobile App Tracking” for consistency and easy troubleshooting for our team.
Step 4 – Create your tag in Google Tag Manager
With your variable created, it is time to create your tag.
For this guide we consider that you have already configured your Google Analytics account into GTM, this is a requirement in order for the next steps described in this guide to work correclty.
To get started click “Tags” on the left sidebar:
Click the “New” button on the right side:
Name your tag the following: “Vendrux – Mobile App Tracking Tag” then click the “Tag configuration” block:
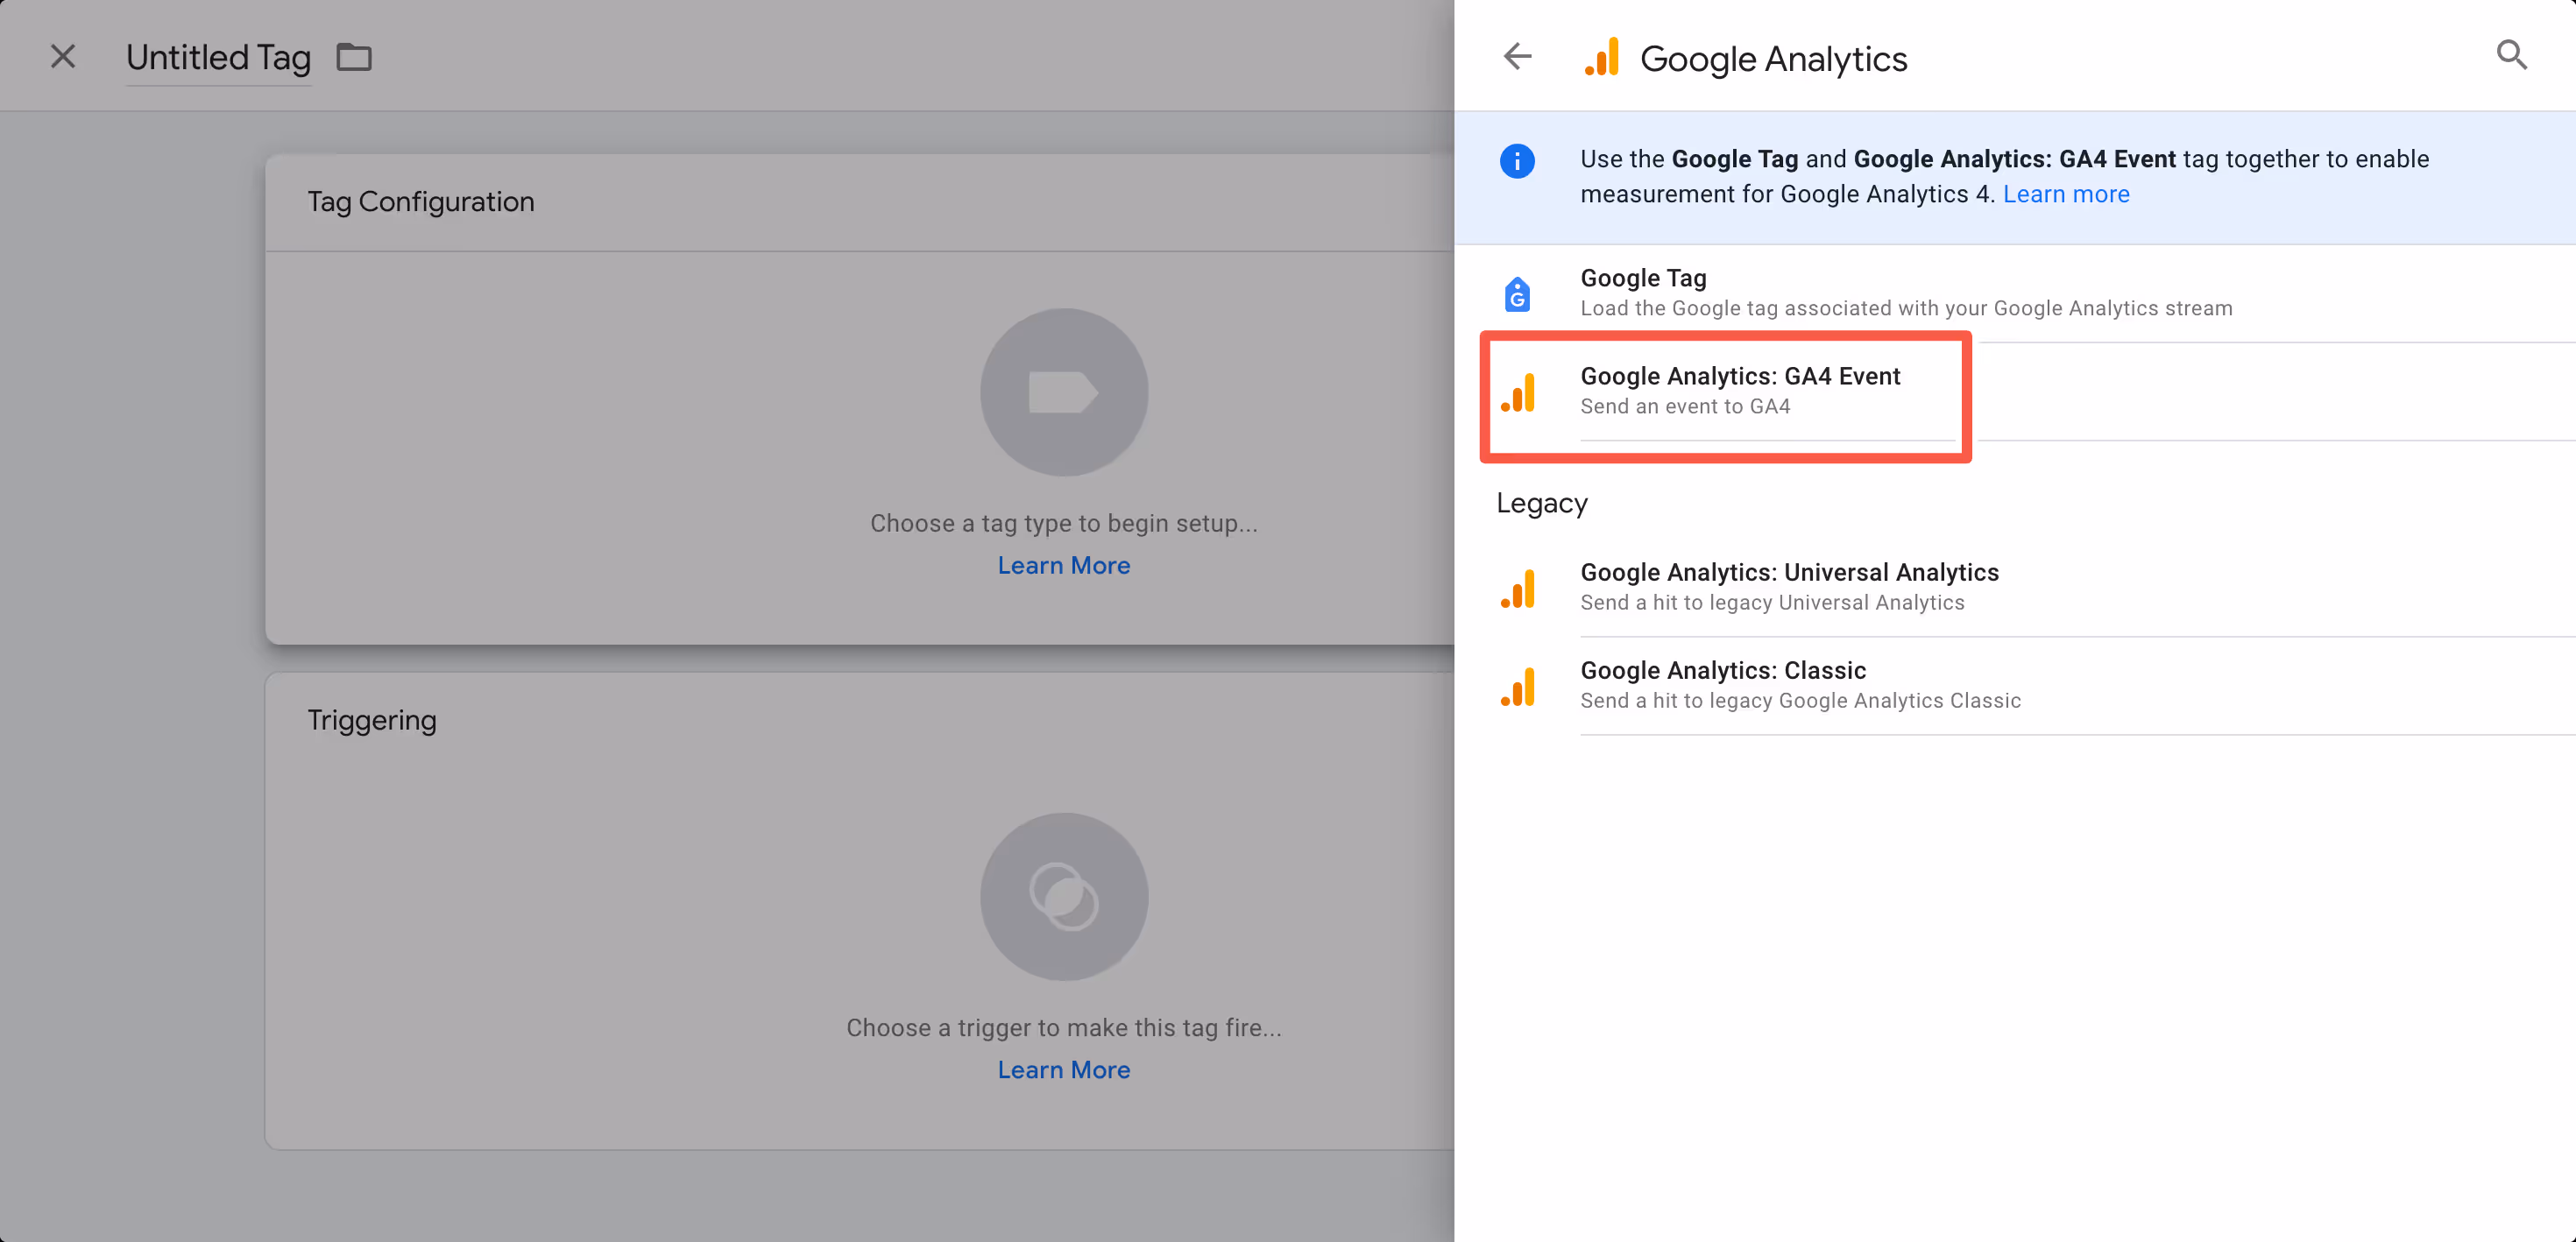
Select “Google Analytics” in the list of “Featured” tag types:
Select the “Google Analytics: GA4 Event”:
Fill in the “Measurement ID” field with the value you previously copied from your Google Analytics account:
Expand the “User Properties” area and fill the “Property Name” field with “app_session”:
On the “Value” field, click the small brick icon and pick the variable you created in the previous step:
Now click the “Triggering” block:
Select “All pages”:
Click “Save”:
Step 5 – Submit your tags and install Google Tag Manager on your website
The first step now is to submit everything you created, so it goes live into production, you can do that by clicking the “Submit” button on the right side of the screen:
Google will ask you for a few confirmations, but just click the “Publish” button until your changes are submitted.
If you never used Google Tag Manager before, you might need to add its code to your website, you can find all the details on how to implement the code to your website by clicking on your Tag Manager ID, here:
Congratulations, if you followed all steps until this point, you should now be tracking all users that are viewing your website through the app.
UTMs (Urchin Tracking Modules) are a great way to track the performance of your push notification campaigns, and the behavior of the users who get to your app through a push notification, in Google Analytics.
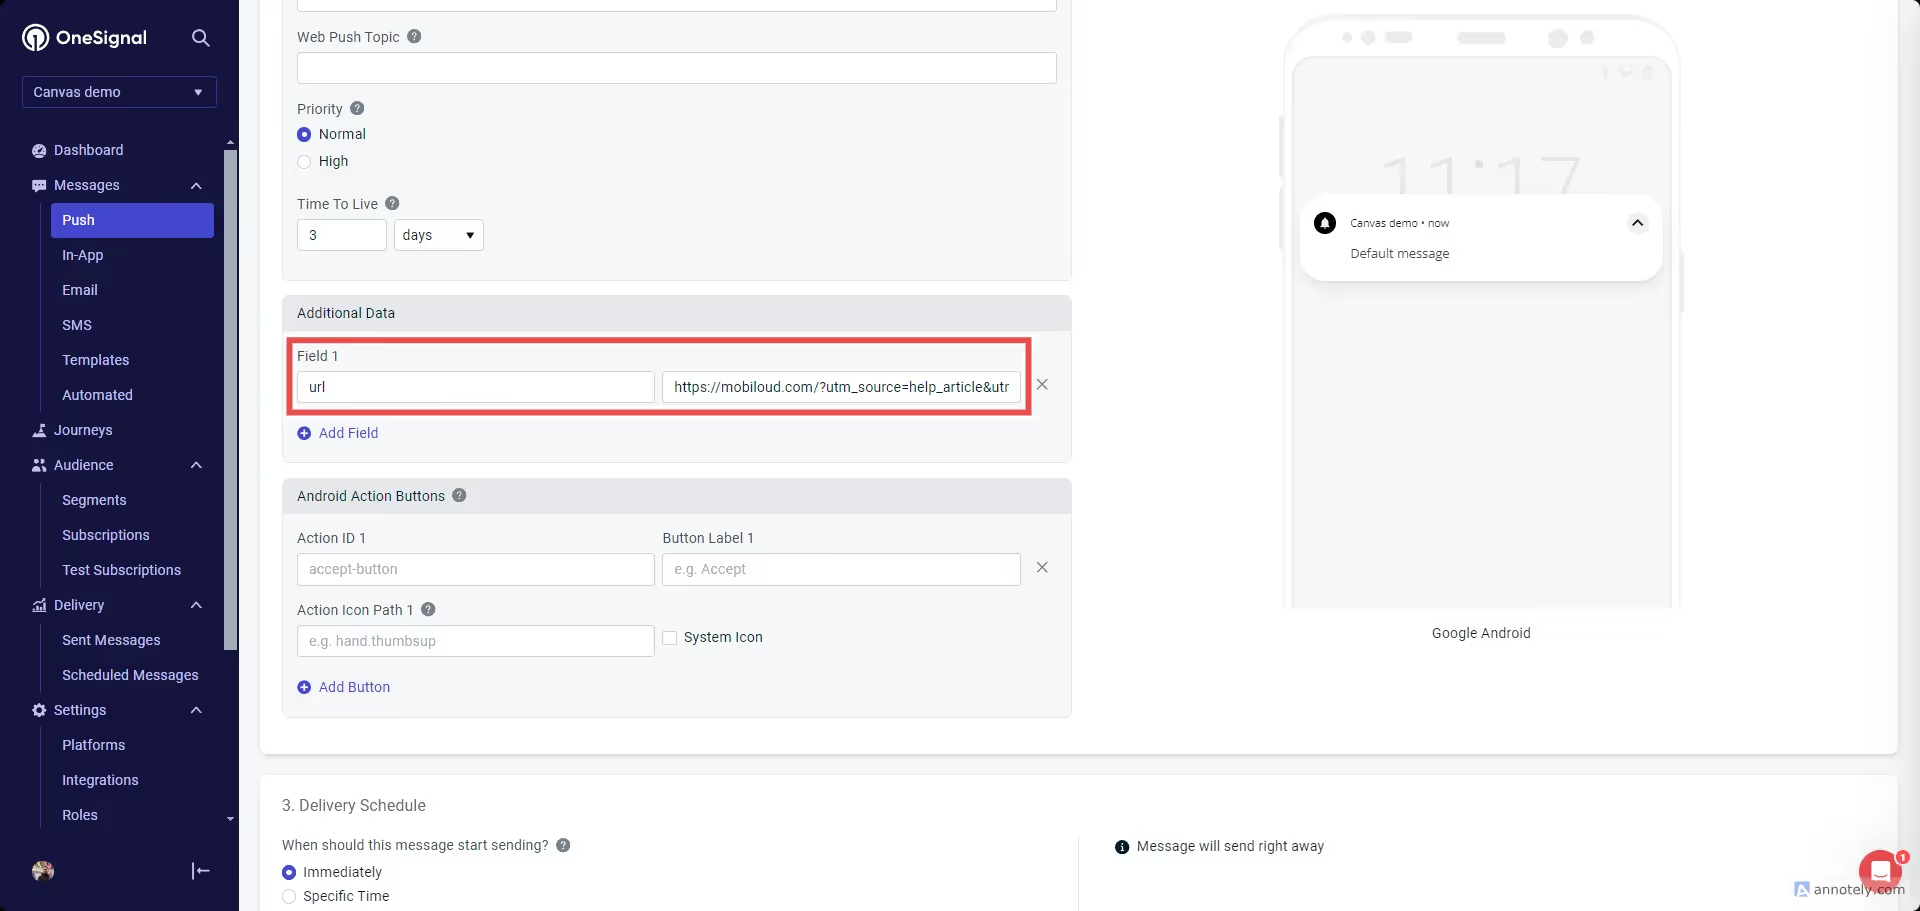
Here is an example of how your URL will look like after you add your UTM parameters: https://vendrux.com/?utm_source=help_article&utm_medium=link&utm_campaign=utm_education
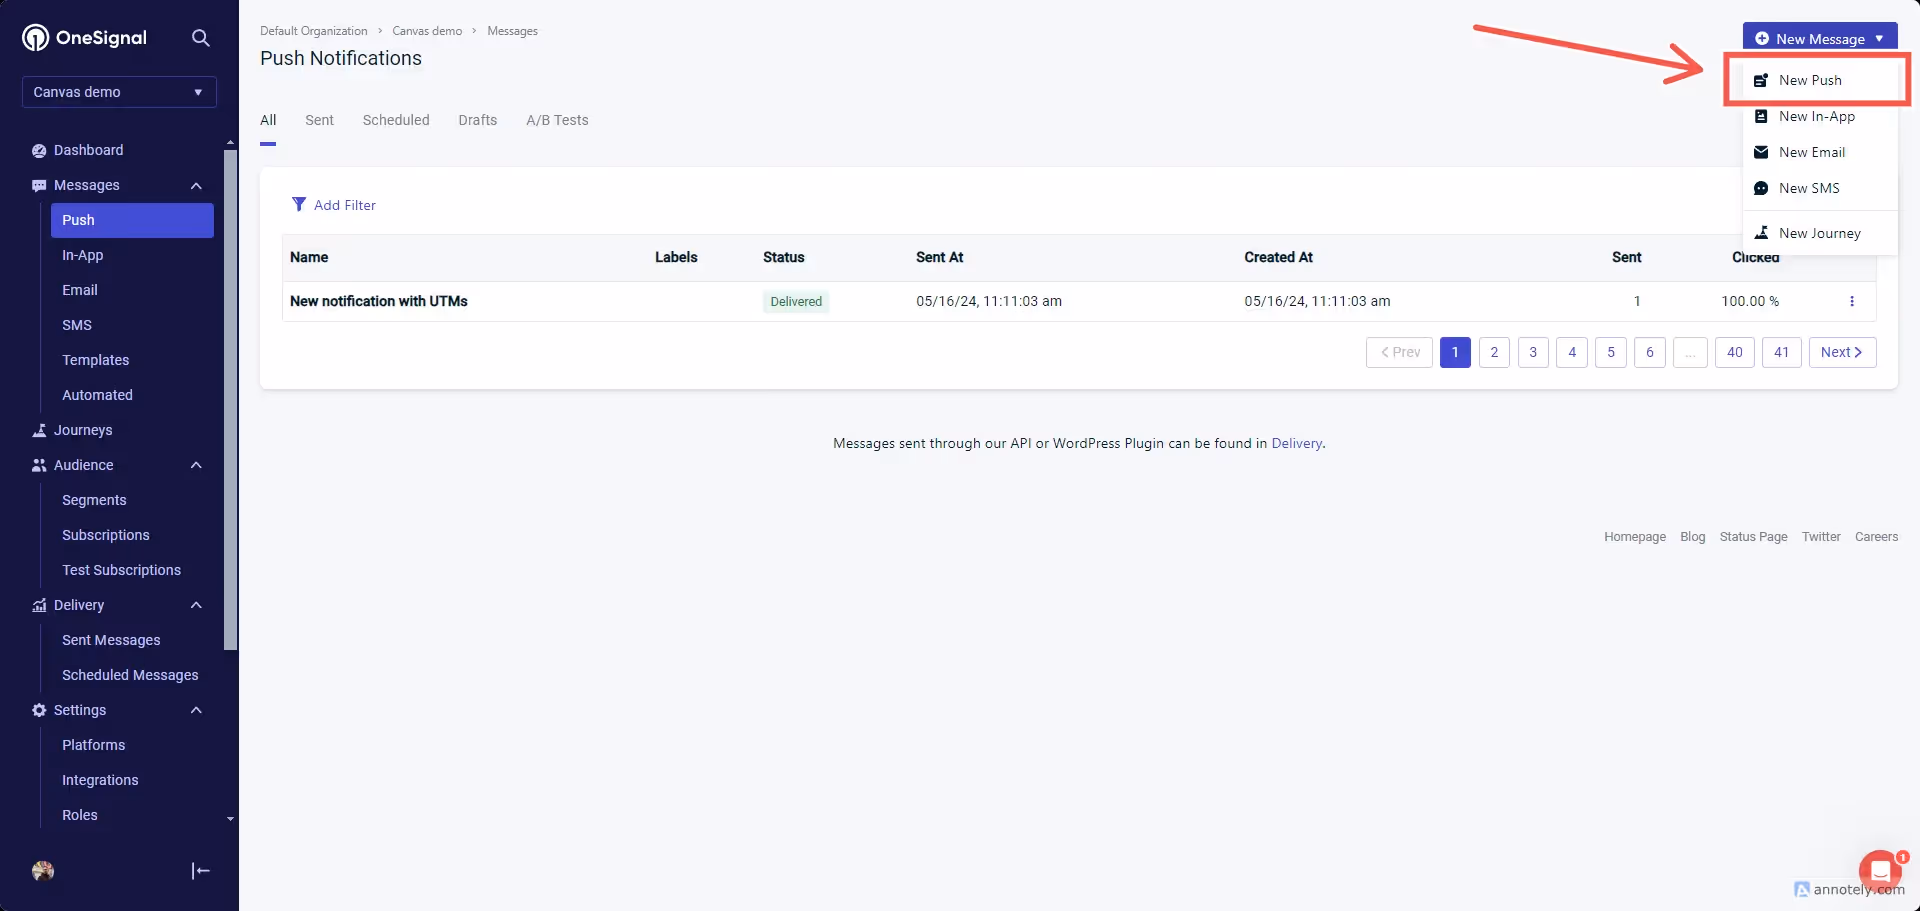
In your account’s “Push” area, on the top right side, click “New push”:
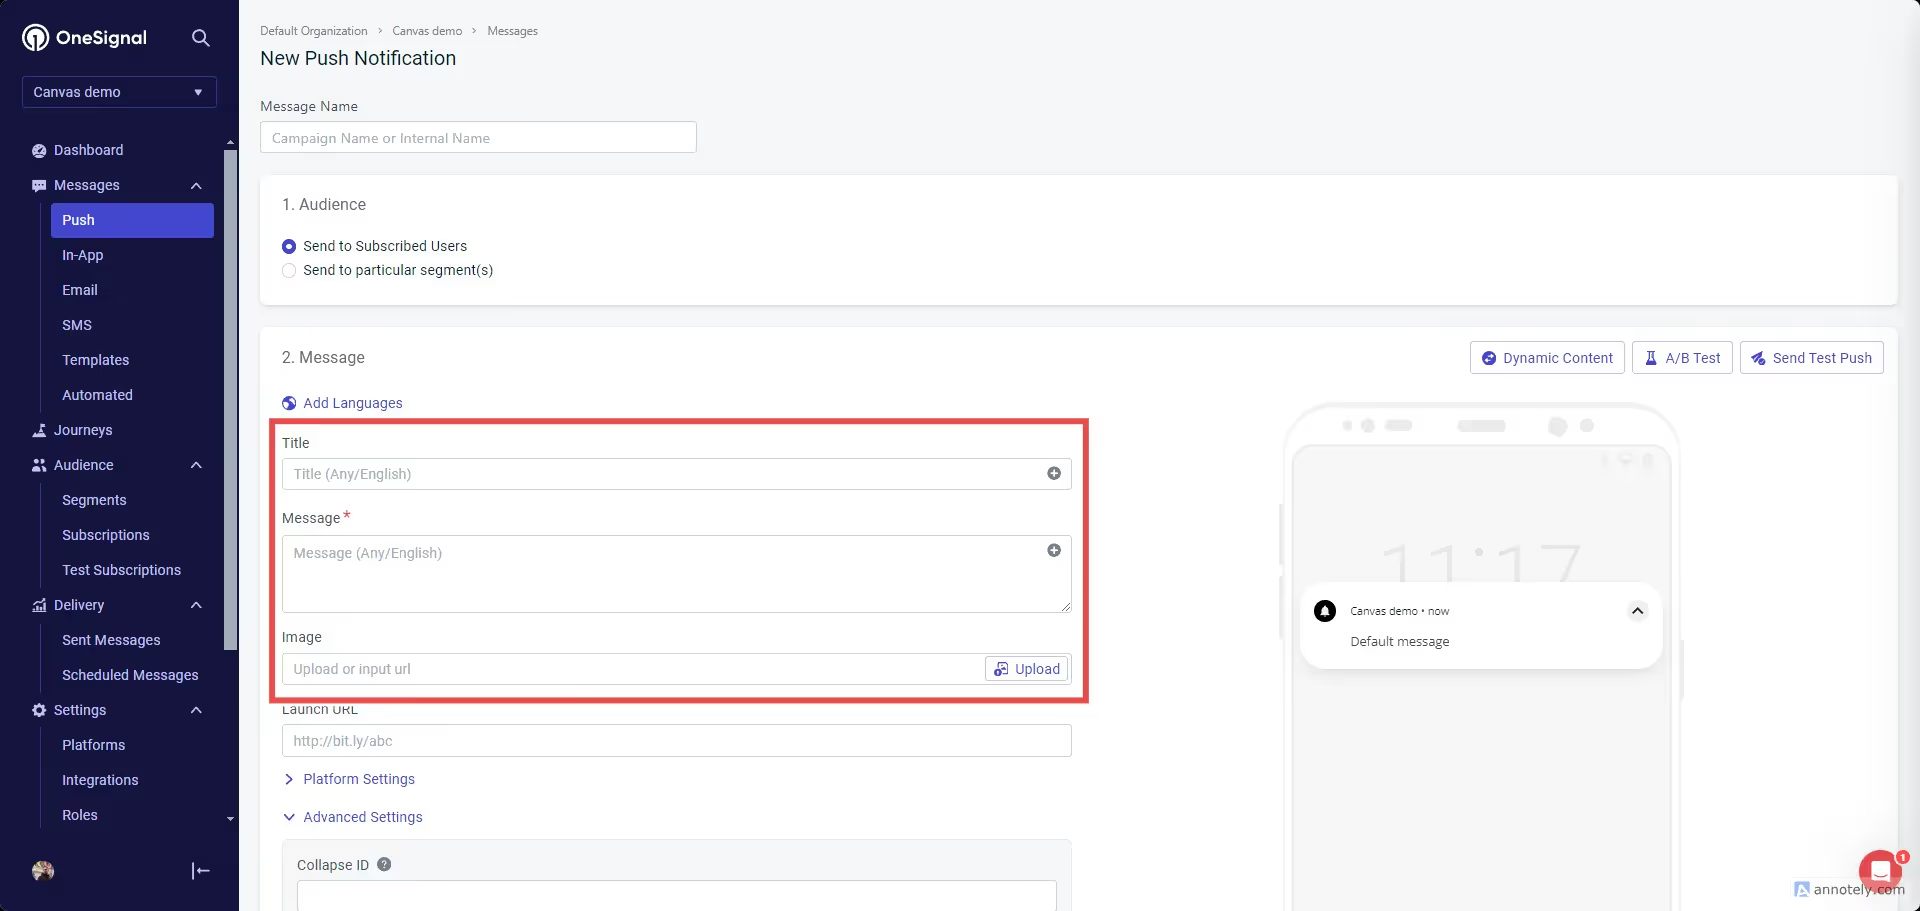
Fill your push notification content with a title, message, and image (optional):
For your notification URL scroll a bit further until you see the “Additional Data” field. In the first field type “url”, and in the second one add your URL containing the UTM parameters:
That’s it! You can now send the notification to your users and track the UTM parameters via your Google Analytics account.
OneSignal provides accurate information about how many users have subscribed to receive push notifications on your app, and how many of these users are active on a monthly basis.
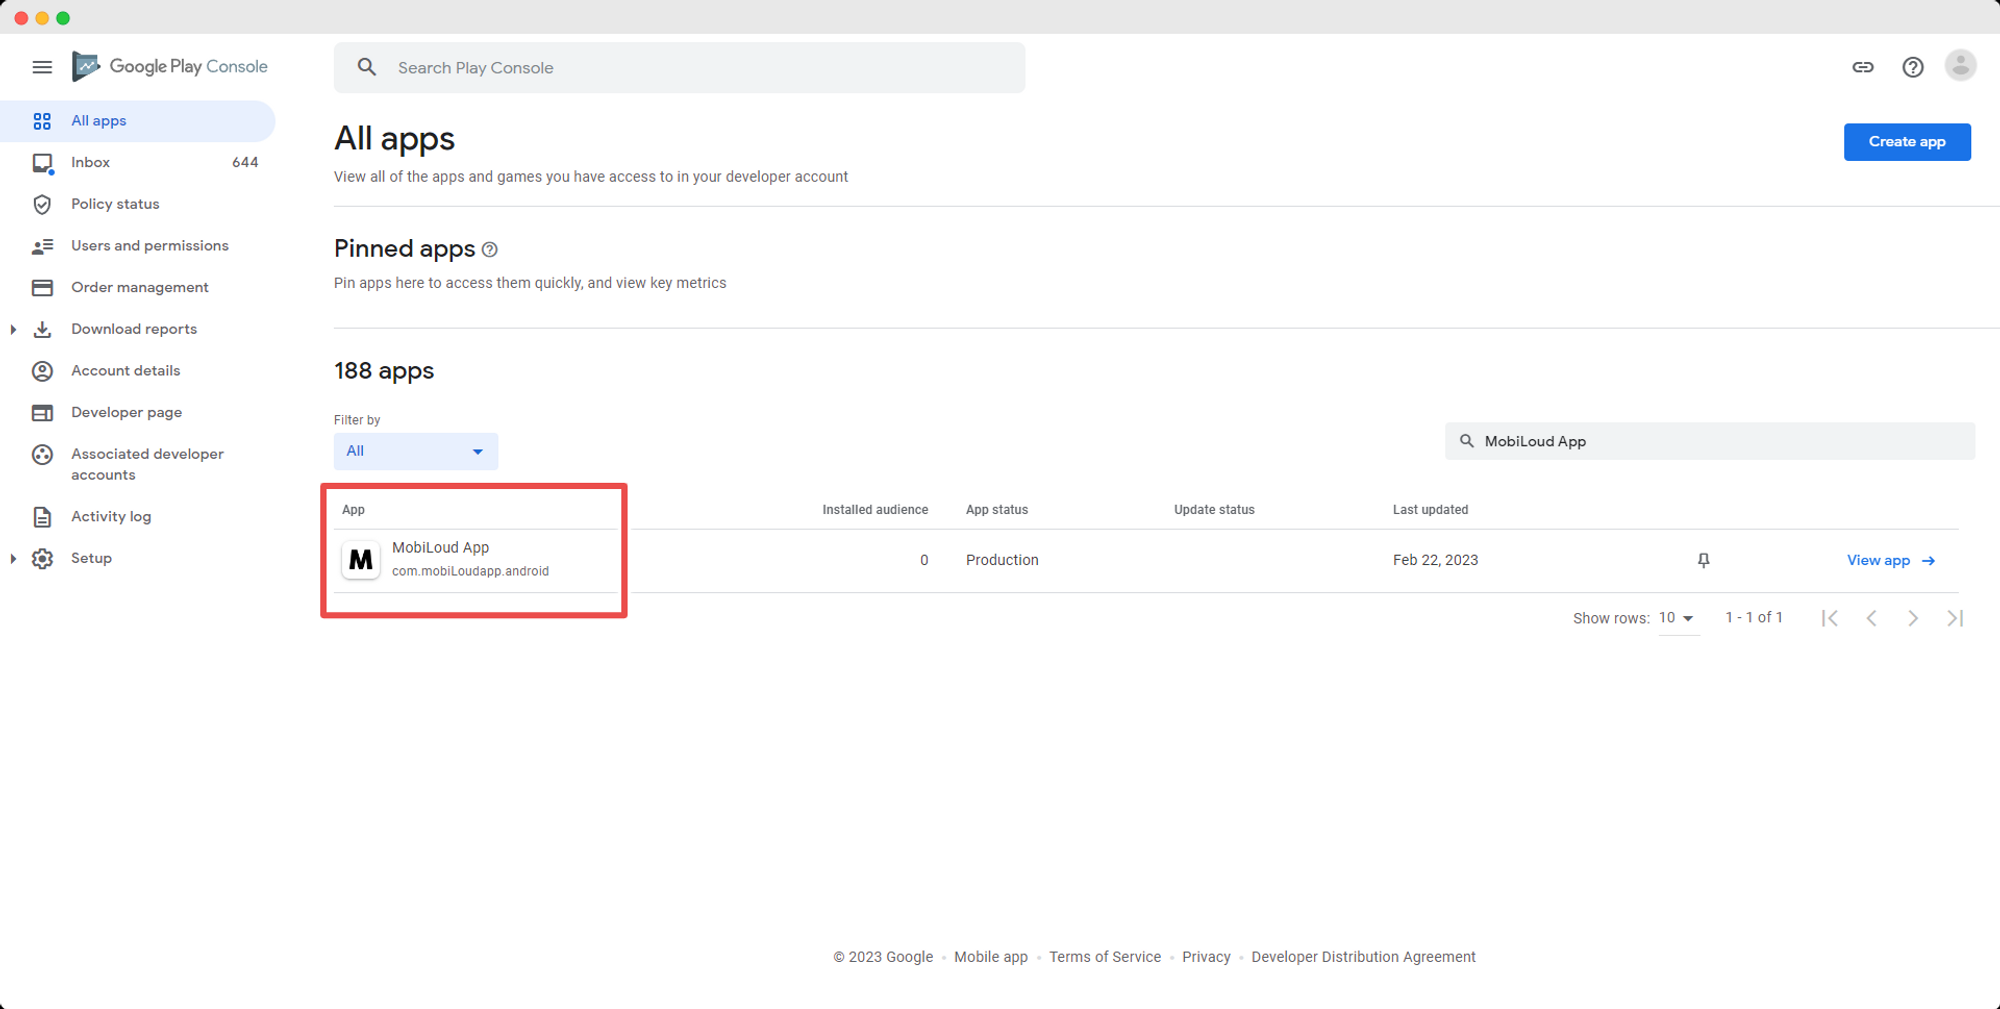
After logging in, click on the app for which you want to see the usage information
3 – Usage information
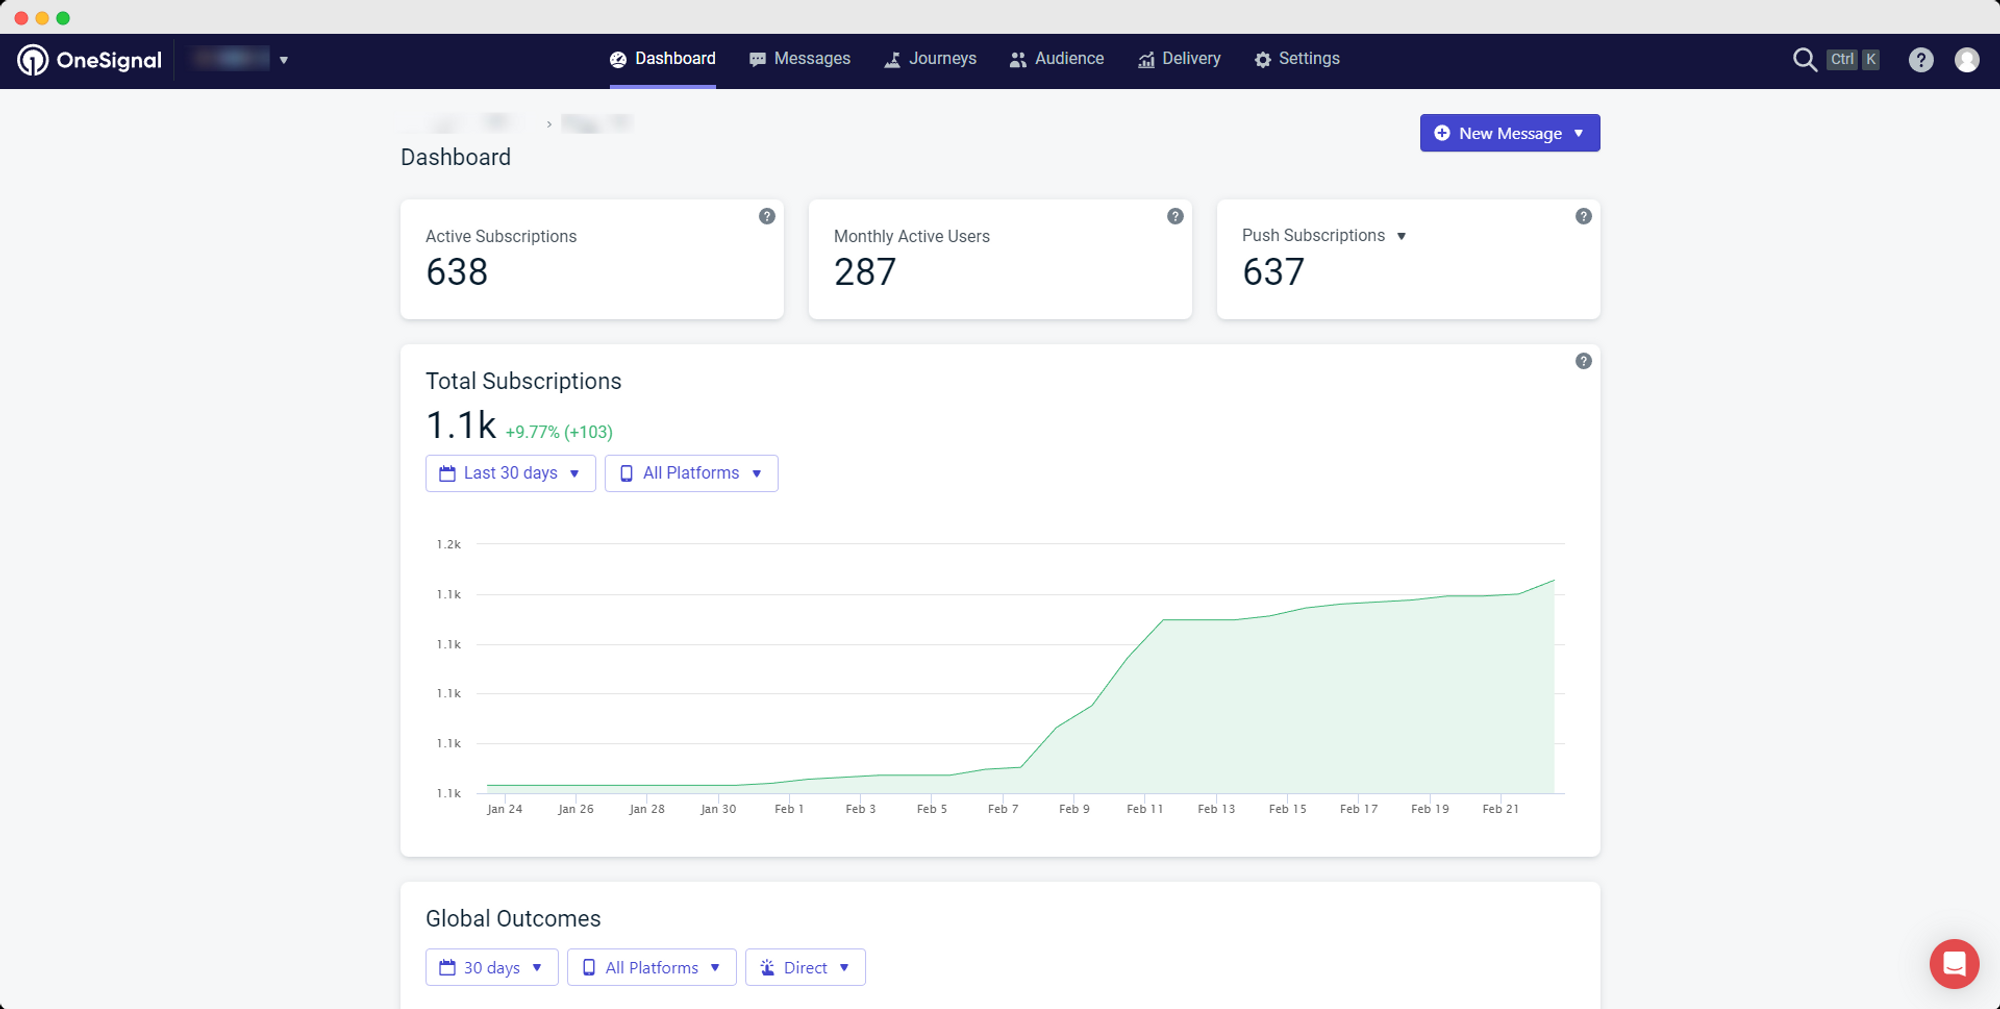
Right after selecting your app, OneSignal will display general usage information about your app, as you can see below:
These are the metrics you want to be looking into:
Monthly Active Users: an estimate of the number of users who have used your app in the last 30 days. Examples of activity include opening a notification, opening the app, and receiving tags from the app.
Push Subscriptions: this number is the total count of active push subscriptions
2 – Select your app from the list of available apps
3 – Navigate to the Statistics tab in the left-hand menu
4 – Usage information
Under the “Statistics” area you can find your app usage details, you can change the period as well as the metrics using the different options on that page:
All Vendrux apps make use of Firebase for usage and performance tracking.
If you have live apps and want to be able to see how many active users are active on each platform, you can do that from your Firebase account, in the Firebase Analytics area.
On the left sidebar, you will see a section called “Analytics”, click on it:
4 – Open the “Dashboard” area
In the new area that appeared, click on “Dashboard”:
You will now be able to see analytics data tracked for your apps, to see more detailed information you can select the platforms (iOS or Android) by clicking on the following elements:
With Vendrux you can easily track your app usage in Google Analytics, but there is a way to create a specific area in your Google Analytics account where you can see your app data, organized according to your needs.
There are a few steps to follow but you will only have to do it once.
Follow the steps below to create reports that are dedicated to your app.
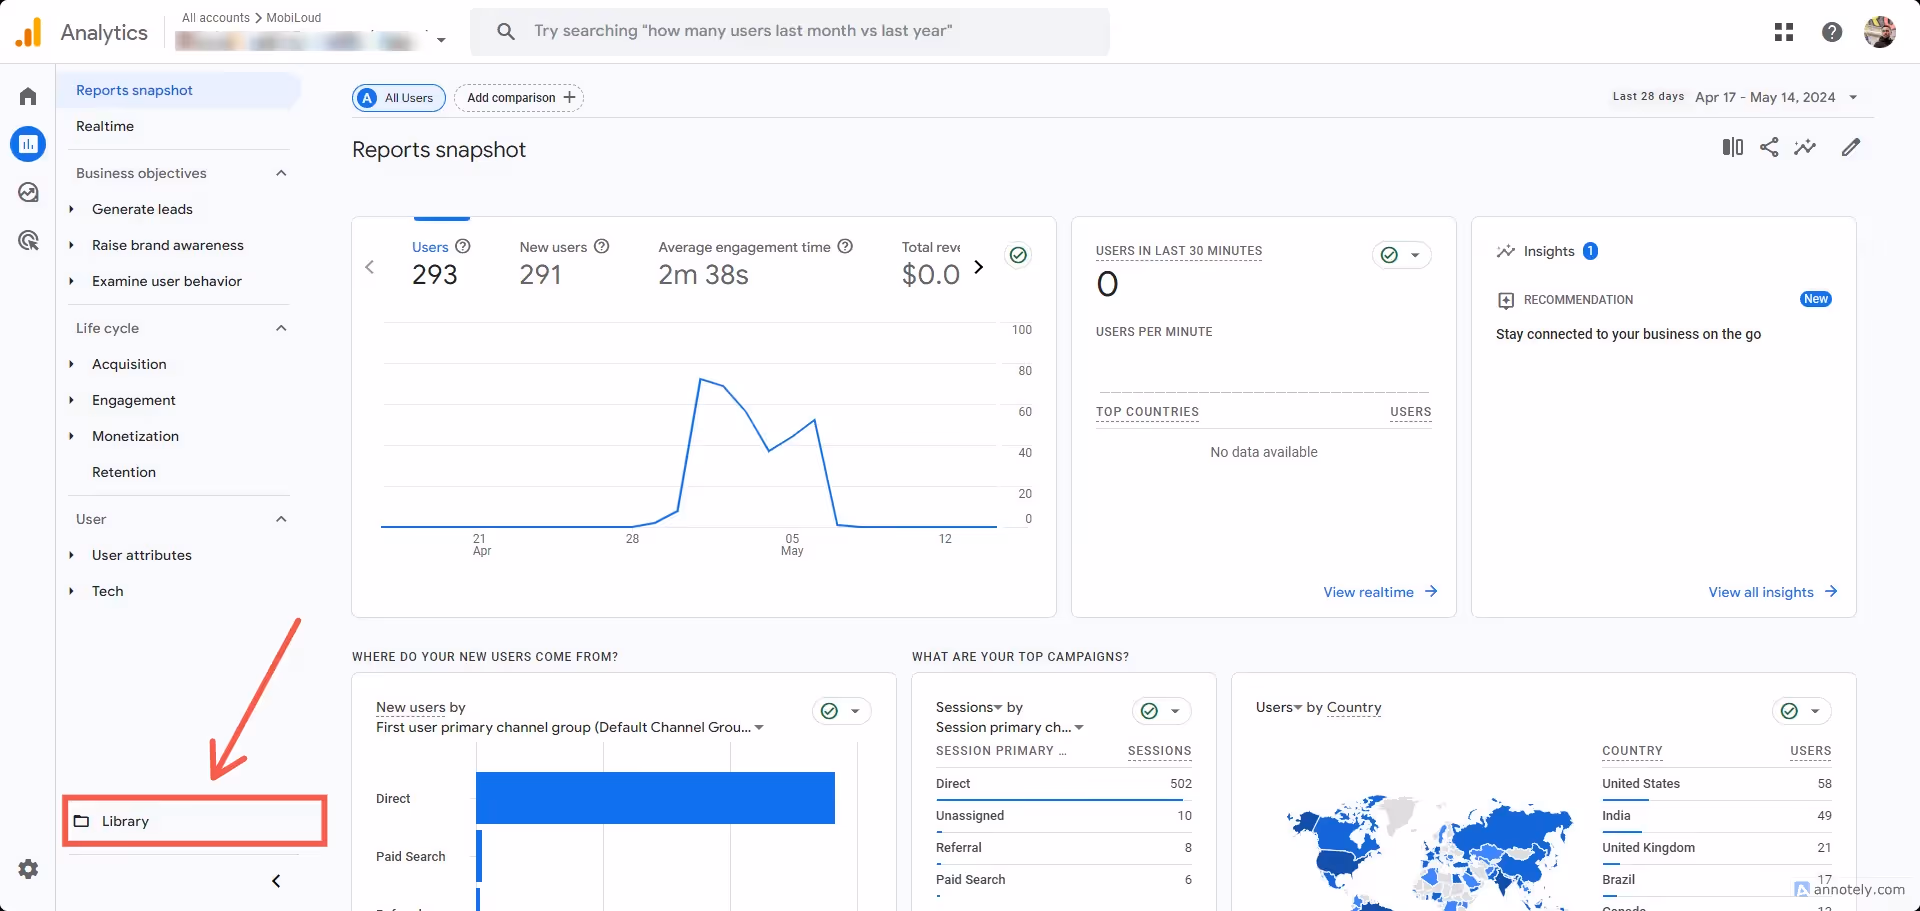
Under “Reports”, click the “Library” link at the bottom left area of the screen:
Click the “Create new report” button:
Select “Create detail report”:
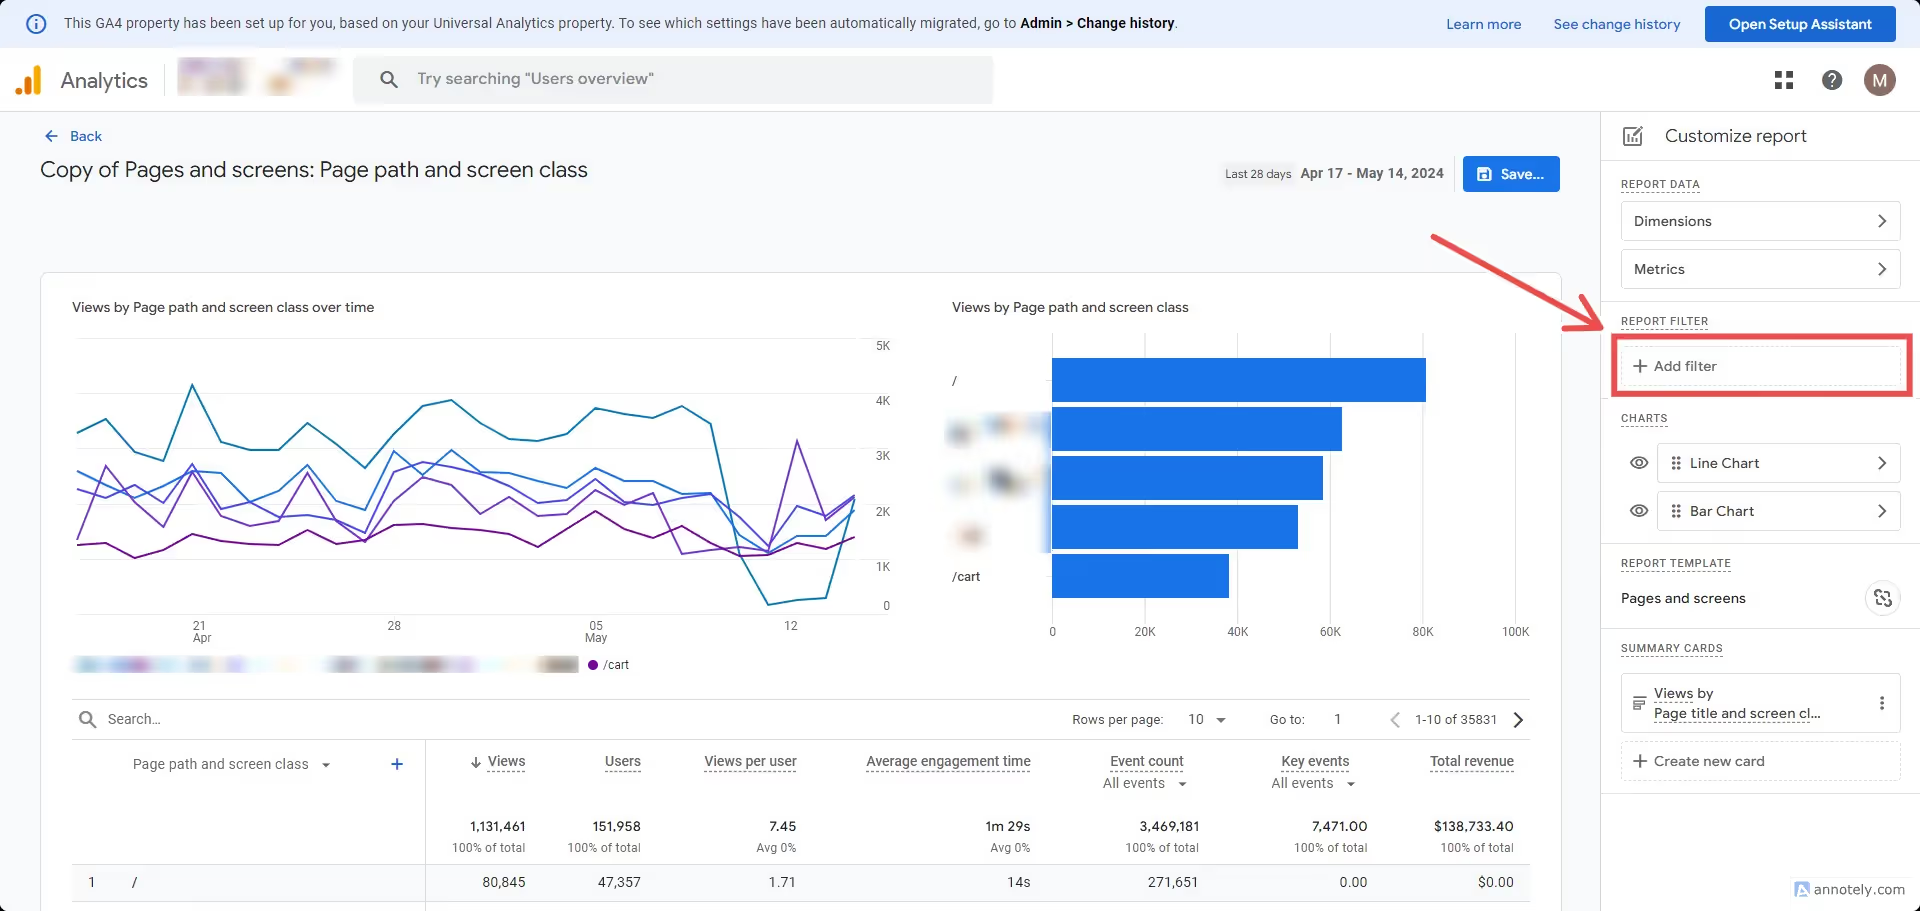
You will be presented with a list of all the existing detail reports, pick one that you would like to replicate for the app, in this example we will go with the “Pages and Screens”:
Click “Add filter” on the right sidebar:
Use the custom dimension you previously created. If you used the labels we suggest, select “app_session” as the dimension, “exactly matches” as the match type, and “true” as the value, then click “Apply”:
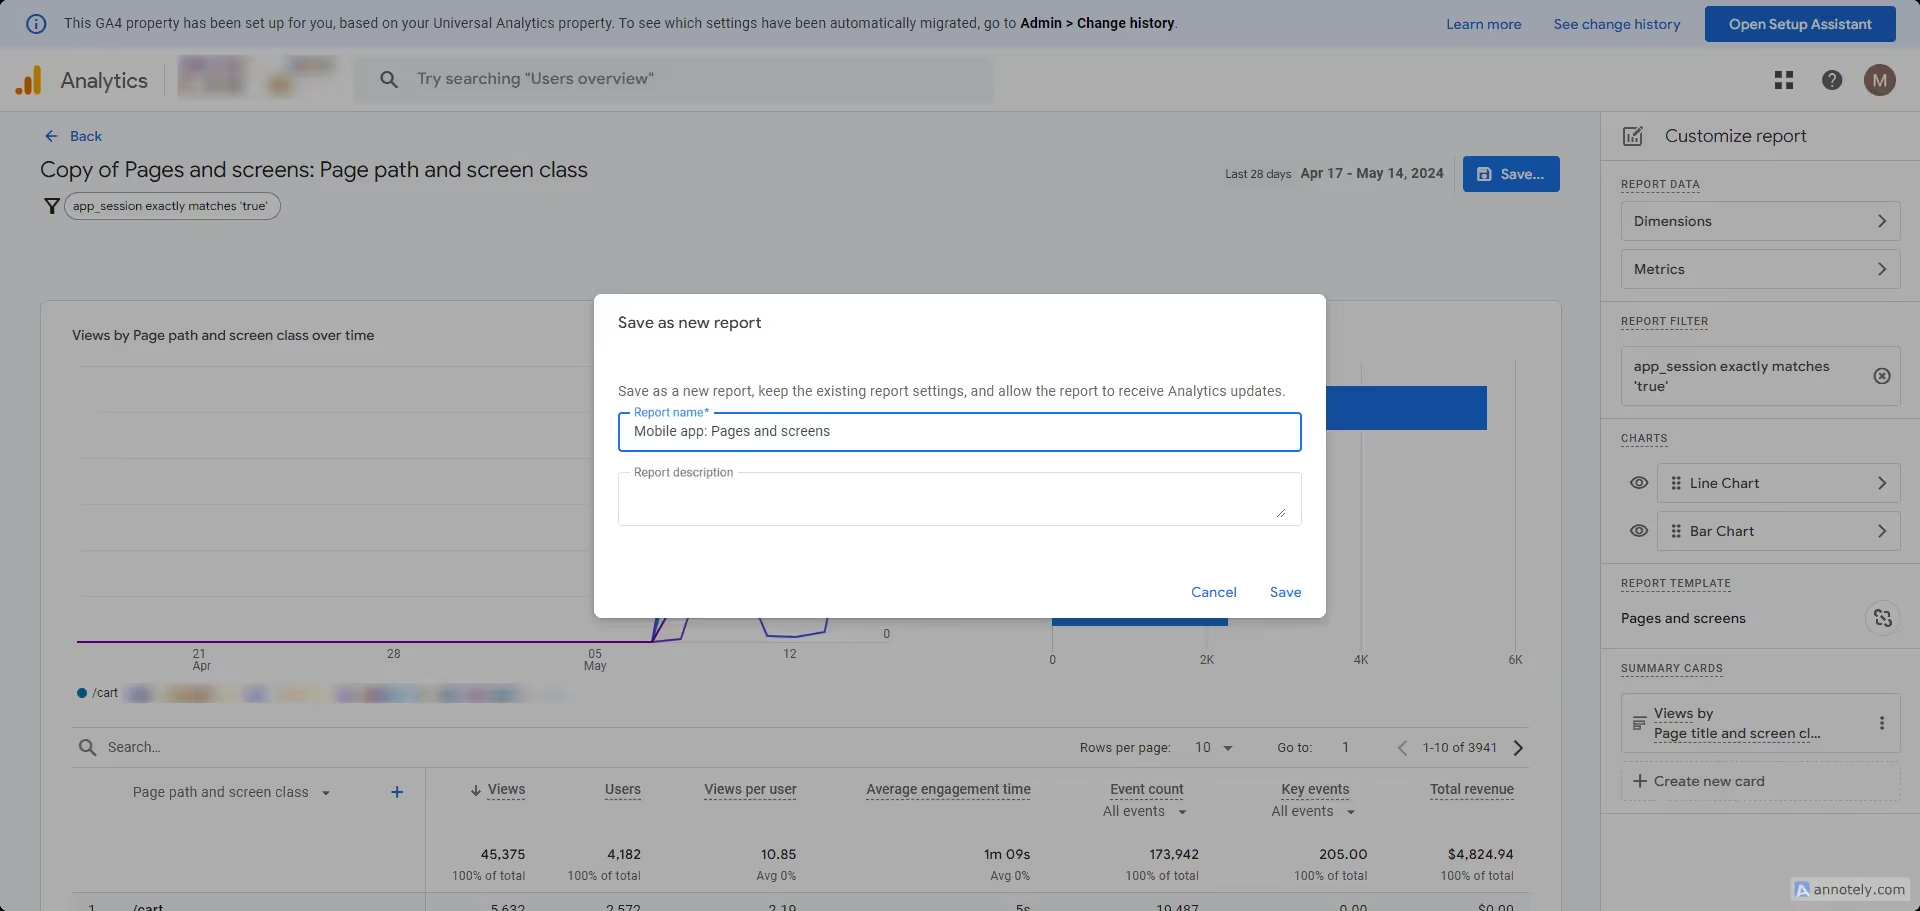
Now save the report by clicking “Save…”:
Add a name that makes the report easy to recognize as an app specific report:
Your first report is now created and you can use it in the collection that we are going to create next. Note that you can replicate these steps to create more reports based on pre-existing ones. We suggest doing the same for:
Pages and screens
Events
Ecommerce purchases
Traffic acquisition
Once you are done, we will proceed with creating a collection, so you can easily access these app specific reports from your “Reports” area in Google Analytics.
To start go back to “Reports”, then click “Library”, but now click the “Create new Collection” block:
Select “Blank” to create a new collection:
Click on the collection name to name it. We suggest using “Vendrux App”:
Click “Create new topic”:
Add the following topics “Engagement” and “Push notifications”
Now drag and drop the reports you previously created into the topics, as you can see here:
Save your changes:
And go back to the previous page:
Now make sure your new collection is published:
You should see the new collection on your left sidebar:
If you would like to see the analytics information tracked by Firebase directly in your Google Analytics Dashboard, follow the steps below:
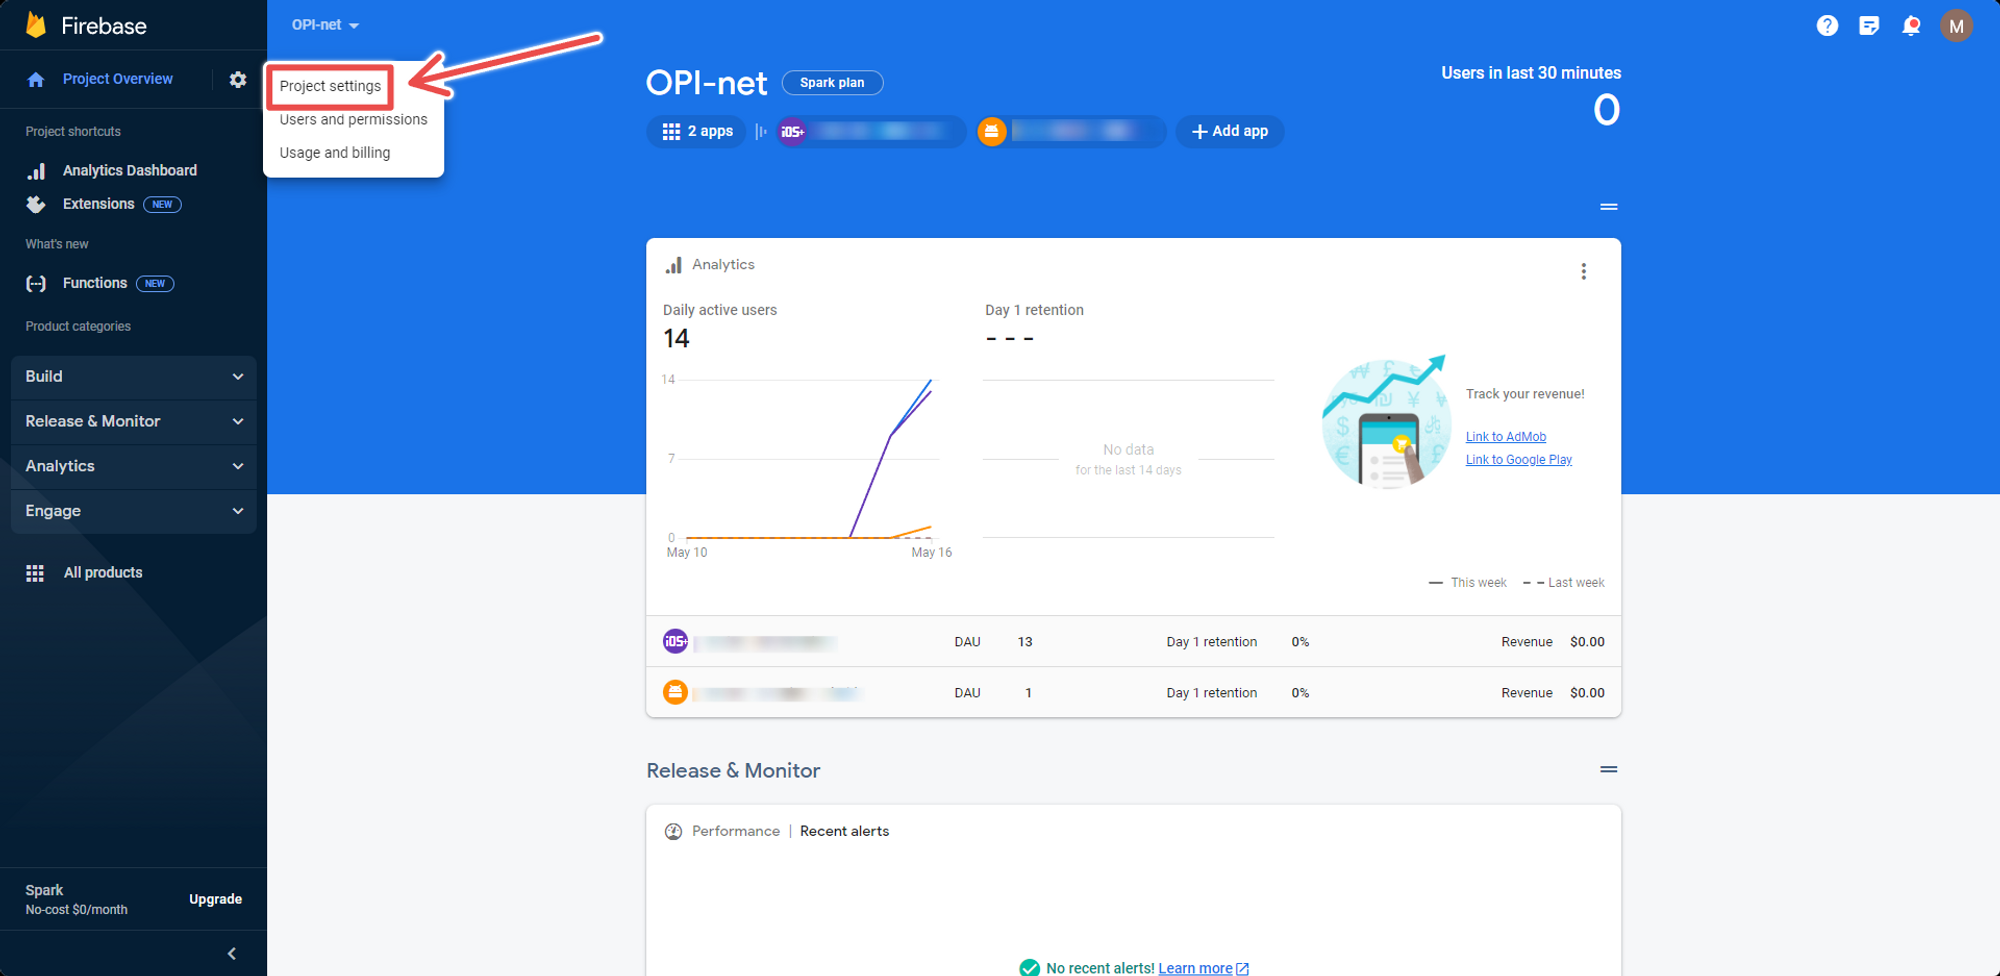
1 – Go to the Project Settings
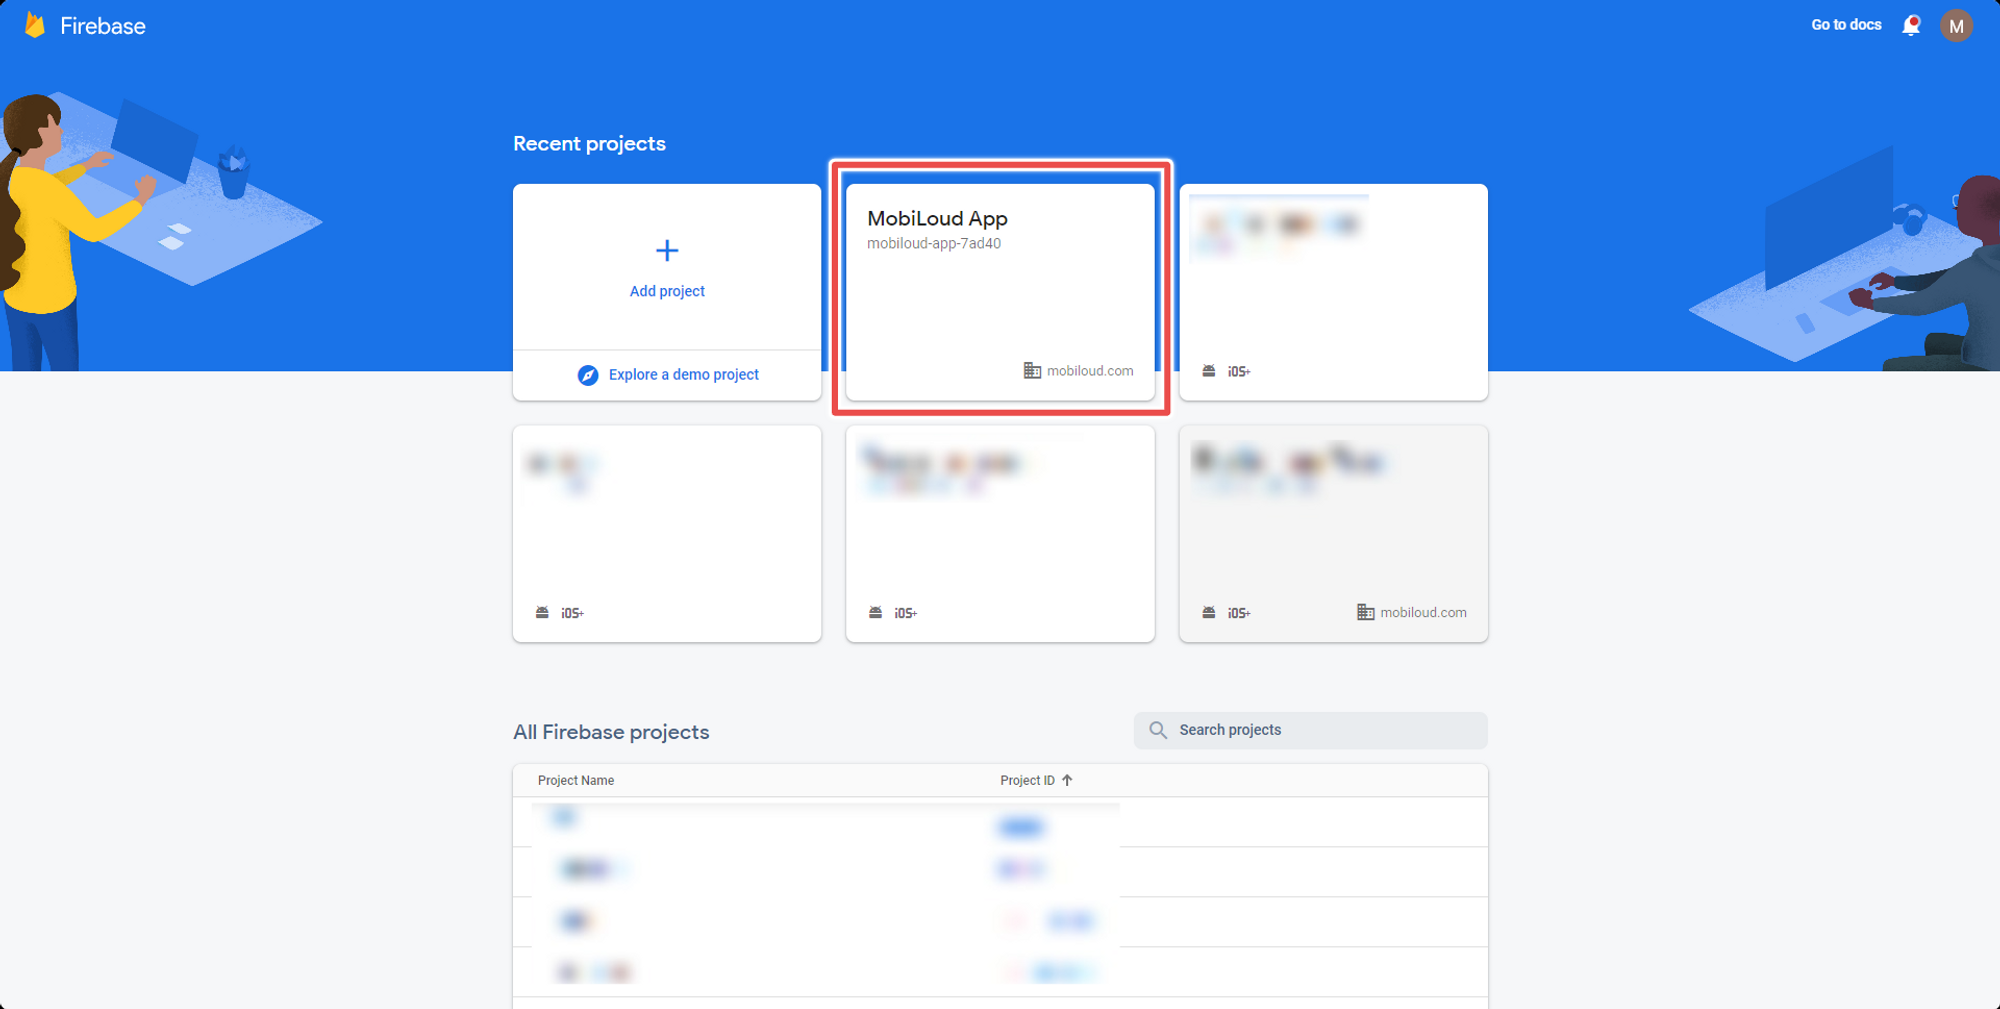
Open your Firebase console and selected your app, then click on the gear icon next to the “Project Overview”:
2 – Enable the Google Analytics Integration
Click on the “Integrations” tab and then “Enable” on your Google Analytics Integration:
3 – Select your Google Analytics Account
You will then be prompted to pick the Google Analytics account in which the data should be displayed
Note that by default Firebase will create a new property on the selected account, but you can connect Firebase to an existing property if you’d like, just click the edit button as you can see below:
Once all steps have been completed the connected data streams should start feeding the data within 48 hours.


.avif)
.avif)
.avif)
.avif)
.avif)
.avif)
.avif)
.avif)
.avif)
.avif)
.avif)
.avif)
.avif)
.avif)
.avif)
.avif)
.avif)
.avif)
.avif)
.avif)
.avif)
.avif)
.avif)
.avif)
.avif)
.avif)
.avif)
.avif)

.png)
.png)
.png)
.png)
.png)
.png)
.png)
.png)
.avif)
.avif)


.avif)
.avif)
.avif)
.avif)
.avif)


.avif)

.png)
.png)
.png)
.png)