Writing an app press release has two main purposes: it takes some of the work out of reporting on the release of your app (which news sites will love because it makes their lives easier) and allows you to control the initial perception of your app.
This is an important step when it comes to getting initial visibility and traction for your mobile app.
Read on to learn more, as well as a few tips on writing your app press release.
Why Write an App Press Release?
The aim here is to create awareness amongst your target audience and gain some interest on blogs/news sites. That awareness will (hopefully) translate into app installs.
You need to get a bit of initial momentum in the way of app installs for your app to start showing up in app store searches. Once this happens, you can start getting organic installs from the app stores.
A press release also gives another layer of legitimacy and trust to your brand, and you app. It makes you look like a real business, which people should take seriously.
Tips for Doing Your App Press Release
If you get blogs and news sites talking about your app, you’ll naturally increase awareness with your target audience – but you also want to make sure that it’s the right kind of awareness.
Bloggers usually share the interests of their readers, but they may be more technically interested or have greater expertise than their audience. News sites are typically less of a problem, since they are less about personal opinion and more about audience-focused reporting.
So, as well as intriguing bloggers, a good press release will steer them towards helping to sell your app to the intended audience rather than a select few hardcore enthusiasts.
Here are some other points to consider:
Timing:when you decide to put out your press release is important. There will be optimum times of the week in terms of blog readership levels. Find out what they are and really push to get your app talked about on those days.
SEO: just as you want to ensure your website hits the right keywords, make sure your press release shows up prominently in search results. Publishers will love this because it will drive traffic to their sites (making them more likely to publish it) and it will increase the likelihood that your audience will actually find it if they don’t subscribe to the blog it’s posted on.
Avoid feature lists: the purpose of a press release is to generate some excitement or enthusiasm around your app. Don’t list every feature, focus on what makes your app distinctive when compared with your competitors: what’s unique about what you offer and why should your target audience be excited about that? If it’s something every app does, you can probably skip mentioning it.
Link to the App Store: don’t just link to your website. Make sure you also provide direct links to the App Store or Google Play. If a press release has been really successful your target audience may just want to go try it out. Don’t force them to jump through the unnecessary hoop of visiting your website first.
I’d also recommend wikiHow’s (more general) article on writing press releases. It doesn’t deal with app-specific stuff, but you’ll get a good idea of how to structure a release, how long it should be, what you should focus on, etc.
Final Thoughts
One of the toughest parts of launching something new (such as an app) is getting your first users.
You need a clear strategy in place to do this. A press release for your app is a great way to go about it, by getting eyeballs on your app, as well as painting your brand as something to be trusted.
Take our tips above on board when writing your own press release, and launch your app the right way.
You’ve got your app name and mobile app icon sorted. Your potential user was interested enough to open your app’s page, now it’s time to convince and convert that opportunity in a download. That’s what your app store description is for (along with icon and screenshots).
When it comes to app store optimization, your description is a big part. It’s the part that’s going to seal the deal, after your hard work to get potential users on the hook.
Read on and we’ll share some tips on how to write an app store description that produces more app downloads.
App Store Description Writing Tips
Want to write better app store descriptions? It’s not rocket science – you don’t need a degree in marketing or copywriting to figure it out.
Anyone can write an app store description that captures the reader’s attention, clearly and concisely explaining why they should download your app.
Here are some tips.
Start your description with something that really grabs the attention.
Go take a look at the App Store and have a look at how much of the app store description is shown by default (before you click ‘More’). Not much, is it? On Apple’s App Store you have about three lines of text. That’s how long you have to convince a user that your app might be worth their attention.
Unless that first sentence makes you want to read more or take a look at the screenshots, you’re going to be losing potential customers at the first hurdle. Be concise and make it interesting.
So make it the best pitch you can come up explaining what your app does, who it does it for and why it’s unique or better than others.
Lead with the most powerful, crisply stated message that your visitor wants to see
Cut the nonsense or filler – like “Our product is designed in Florida to…” – and just get straight to what the damn thing does and why that’s awesome
Make the user want to click to learn more (so, in many cases, TEASE!)
Be clear about the category of app that you’re selling
Clarity is key here. If it’s a game, don’t leave them guessing. Tell them.
Explain exactly what makes your app unique – why should people choose you over the competition? Make sure it isn’t just a long list of features.
Include social proof and validation
You can tell someone that your app is the best. But anyone can say that about their app, whether it’s true or not. You need to include something in your app store description to convince the target user that it’s worth downloading.
Add any press mentions, blog reviews or customer testimonials. Anything that can back up your claims on how good your app is.
Talk about benefits and features
The meat of your app store description is the features and benefits.
What does the app do – and how does it benefit the user?
The best technique to list features and make sure they’re relevant and help you “close the sale” is to always ask yourself why each is important for your user/customer. Answer the “why it’s important” question for each of your features, and mention it just before or after the feature itself.
By following this simple technique, you take the perspective of your user or customer and explain your features together with the benefit they offer. If you come across a neat technical feature but you can’t come up with a reason why it matters, then just skip it, it’s not about quantity.
Remember, this is a sales and marketing document not a tech spec
This is especially important if you’re using bullet points. Make it about them, your users, not your app or its technical superiority.
This is sales, you need to convince and overcome objections. Some of these might be about whether the app is completely free or not, whether an iPad or tablet version is available or how frequently content in the app is updated. Make sure to mention these points, perhaps using a bullet point list, to overcome common objections (you’ll learn from user reviews what people are concerned with).
How about keywords?
While on Apple’s App Store descriptions are not considered in the ranking algorithm, they do count on Google Play, so you should be quite careful about how and what words you use. Our recommendation to improve the discoverability of your app is inserting your main keyword once in the title, and 5 times in the description.
A great app store description will increase your app’s relevance to potential users, and increase your chance of getting featured in the app store.
In the content management system (CMS) market, one player is well ahead of the pack – WordPress. But just how dominant is WordPress’ market share today? How many WordPress websites are there? And are there any legitimate contenders to WordPress as the market leader?
As you’re about to see, WordPress is as dominant as ever, with nearly half of all websites today built on top of this open-source CMS. Keep reading to learn a number of fascinating statistics about the CMS market, including WordPress’ market share and how it ranks vs the competition among high-traffic websites, ecommerce sites and more.
Data from w3techs.com shows that 43% of all the websites on the internet run on WordPress.
That equates to over 35 million sites using WordPress.
This is more than just the CMS market share. 33% of websites have no content management system (or at least don’t run on one of the many known CMS platforms). These websites are either manually coded, or use some kind of private, custom-built CMS.
The fact that WordPress websites make up nearly half of the internet just shows you how dominant it is in the market.
Have a WordPress site you want to convert to an app? Check out the best WordPress Mobile App Builders, and do it with zero coding.
WordPress Market Share vs Other Top CMS
So, how about WordPress’ market share versus other content management systems?
If we take out the 33% of sites that don’t run on any known CMS, WordPress is even further ahead, with 64.3% market share.
That’s nearly two-thirds of the entire market, occupied by WordPress sites. The next highest competitor is not close; Shopify, which has 6.2% of the market.
Direct competitors to WordPress as free, open-source, community-driven CMS platforms are even further behind, as Joomla and Drupal occupy less than 5% market share combined.
The table below shows where WordPress sites stack up against other popular CMS platforms today:
WordPress Sub-Platforms & Their Market Share
The biggest competition to WordPress today is from ecommerce platforms like Shopify, and site builders like Wix and Squarespace.
However, there are a number of WordPress plugins and other tools within the WordPress ecosystem, which accomplish very similar things – such as WooCommerce for ecommerce sites, and Elementor’s site builder.
How much of the WordPress’s market share is spread across these tools? The following data shows:
WooCommerce 20.3%
Elementor 17.8%
WP Bakery 14.1%
Beaver Builder 1.0%
Other 42.8%
How Many of the Internet’s Top Sites Run on WordPress?
Of WordPress’ market share, how heavily is this weighted towards small-scale or large-scale sites? How many of WordPress’ users are large sites, versus individual bloggers and small businesses? Can a WordPress website work for a large business?
The market share is comparatively lower when we get into the top 10k, 100k or 1 million live websites today. However, WordPress is still the biggest player, with approximately 30% market share for each of these segments.
An interesting takeaway from the data is that Shopify, Wix and Squarespace – the leading competitors in overall CMS market share – are nowhere to be found in the list of top 1 million/100k/10k websites, indicating the bulk of these platforms’ popularity is with beginners or small to medium-sized businesses.
On the other hand, there are some platforms that have a large piece of the top sites’ market share, but occupy less than 0.1% of the overall market share, as you can see from the data for the top 10k live websites:
Drupal also makes an appearance – the only CMS in the top 5 for this segment, other than WordPress, that also features in the top 10 overall platforms by market share.
Trends: Is WordPress’ Market Share Increasing or Declining?
WordPress is the big leader in terms of CMS market share today. But which way is it trending? Can we expect WordPress to keep increasing in market share, or are new players like Shopify going to take over?
Yearly trends show that WordPress’ market share is steadily increasing – from 54.3% in 2012, to 64.3% in 2022.
This indicates WordPress will continue to be the biggest player in the CMS market. However, it is worth noting that WordPress has mostly gained market share on like-for-like competitors – free, open-source content management systems like Joomla and Drupal.
Shopify, Squarespace and Wix, all of which offer a point of difference to WordPress, have also emerged from having little to no usage 10 years ago. It may be reasonable to assume that these platforms will take some additional market share from WordPress in the coming years.
Trends: WordPress’ Total Market Share (All Websites)
Looking at the yearly trends including websites with no CMS detected, the increase in popularity of WordPress is even more significant. A decade ago, 71% of websites were hand-coded, and only 15.8% of the internet ran on WordPress.
Today, as WordPress powers 43% of the internet, its market share has almost tripled.
Related Article: the best WordPress Mobile Plugins to build a responsive cross-platform WordPress site
What Are WordPress’ Biggest Competitors in the CMS Market?
Let’s take a look at the most popular content management systems other than WordPress, and how they compare.
Shopify
The clear 2nd most popular CMS platform today is Shopify. Built for online stores, it’s more focused than WordPress, and more beginner-friendly.
The tradeoff is a little less flexibility, as well as the fact that you need to pay a subscription to use it, unlike WordPress, which is free (outside of the cost of web hosting services and a domain name).
Shopify is never going to be the #1 in CMS market share, since it’s a specialized ecommerce platform. You’re not going to run your blog or a professional (non-ecommerce) website on Shopify. However, it does offer a more user-friendly alternative for online stores, along with an ever-growing market of third-party apps, plugins and themes to help you build a professional store with no coding.
The big rise in the last 10 years has been in site-building platforms, such as Wix. A little different to an open-source CMS like WordPress, these platforms are designed more for absolute beginners, designed to make it quick and easy for anyone to launch a website.
With millions of sites running on Wix, it’s clear there is a market for alternative web hosting platforms. However, the lack of flexibility and scalability with Wix websites is likely to hold it back from really challenging WordPress, and is why its market share declines among the top 1 million websites.
Squarespace offers a very similar value proposition to Wix, and occupies a very similar market share as well.
Like Wix, it has many of the same pros and cons. It’s a more structured way to build a website, which is good for beginners, and it comes with some built-in tools to help online stores get up and running.
While the demand for visual site builders like Squarespace and Wix may increase in the coming years, it’s not likely to come close to WordPress’ market share. Not only is WordPress more flexible, more scalable and better for SEO (search engine optimization), it has a lot of tools that do the same things Wix and Squarespace do.
With WordPress themes, you have ready-made templates that require no coding to look great. The WordPress plugin repository has nearly 60,000 plugins available to handle almost any kind of functionality you might want. And furthermore, page builders like Elementor and WP Bakery offer site-building features, as do some popular WordPress themes.
The other WordPress competitor worth mentioning is Joomla.
Unlike Shopify, Wix and Squarespace, Joomla is not a new player on the market. It’s been around nearly as long as WordPress, and is built in much the same way. Like WordPress, Joomla is a free, open-source platform, built and maintained by its community.
Also like WordPress, it offers value in its flexibility and scalability. There’s a market of third-party plugins, themes and tools for Joomla, though not nearly as large as the market for WordPress plugins and tools.
Compared to WordPress, Joomla has a bigger learning curve, and is not quite as intuitive, especially for non-developers. That’s likely the reason that its market share has declined over the years – dropping from 10.9% market share in 2012 to just 2.5% today; most of which has been taken over by WordPress.
We’ve established that Shopify is the biggest competitor today to WordPress as a CMS. But how does this compare to WooCommerce, the most popular ecommerce plugin within the WordPress platform?
Across the entire internet, WooCommerce makes up 25% of all ecommerce websites, according to data from BuiltWith, putting it 2nd in terms of ecommerce website market share.
It’s ahead, however, if you consider the top 1 million ecommerce websites, with 26% versus Shopify’s 20%.
Get a deeper look in the data below, with WooCommerce vs Shopify and other ecommerce platforms.
In the top 1 million, platforms like Wix and Squarespace again drop off, while new players such as Magento and OpenCart emerge:
Related: easily convert your WooCommerce site to mobile apps with a WooCommerce App Builder.
Wrapping Up
The number of websites powered by WordPress today shows it’s still the dominant force in the CMS market.
Its market share is only growing, as the number of sites built without a known CMS has dropped considerably.
Today there is very little competition from similar open-source CMS platforms, such as Joomla and Drupal. These users appear to have flocked to WordPress, which boasts a significantly more active community, with more tools, plugins and themes built for WordPress than any other platform.
The only competition today comes from site building platforms, such as Shopify, Wix and Squarespace. While these sites offer a decent alternative for beginners with no previous experience creating websites, the figures from the top sites on the internet show that big companies don’t want to build their online presence on platforms like these.
Will WordPress continue to be the #1 name in the CMS market? All signs point to yes.
If you’re choosing between WooCommerce and Shopify, you’re looking at the two biggest ecommerce platforms in the world. Between them, they power the majority of online stores.
But how do they actually stack up in terms of market share, store count, and growth? Here’s a comprehensive breakdown of the latest data – updated for 2026.
Want weekly insights into how 7, 8 and 9-figure brands are driving sustainable growth? That’s what you get with our value-packed newsletter, The Retention Edge. Subscribe for free today.
Key Takeaways
Shopify holds 26.2% ecommerce platform market share, powering approximately 4.8–6.5 million active stores worldwide.
WooCommerce holds between 20-33% market share (depending on methodology), with over 4.5 million active stores tracked by StoreLeads.
Among high-traffic sites, Shopify leads with 28.8% of the top 1 million ecommerce websites, compared to WooCommerce’s 18.2%.
Shopify’s GMV reached $292 billion in 2024 and is on pace to exceed $350 billion in 2025.
WooCommerce’s estimated GMV is $30–35 billion annually – much smaller in transaction volume, but spread across more stores.
Together, they power over half of all ecommerce websites on the internet.
A Note on Market Share Numbers
Before diving in, it’s worth understanding why you’ll see different numbers depending on where you look.
Market share figures for ecommerce platforms vary significantly based on how they’re measured:
BuiltWith scans websites for specific technologies. It tracks checkout implementations and platform fingerprints.
StoreLeads tracks active online stores across platforms using a broader detection methodology.
W3Techs measures CMS usage across the entire web, not just ecommerce sites.
These different approaches produce different results. For example, WooCommerce can show up at 20% in one dataset and 33% in another – both can be accurate within their own methodology. We’ll cite the source for each figure so you can evaluate them in context.
WooCommerce Market Share
WooCommerce commands a significant share of the ecommerce market, though the exact figure depends on how you measure it:
20.1% of all ecommerce websites (BuiltWith, 2025)
33.4% of ecommerce stores tracked globally (StoreLeads, August 2025 – 4.53 million out of 13.6 million stores)
18.2% among the top 1 million ecommerce sites (BuiltWith, 2025)
The gap between these numbers comes down to what counts as a “WooCommerce site.” Over 6.5 million websites have WooCommerce elements installed, but not all of them are active stores running WooCommerce checkout. The 4.53 million figure from StoreLeads represents active stores more specifically.
About WooCommerce
WooCommerce isn’t a standalone platform. It’s a plugin for WordPress, which powers roughly 43% of all websites on the internet (about 518 million sites, according to W3Techs). Over 10% of WordPress installations include WooCommerce.
That relationship with WordPress is a big deal. It means WooCommerce benefits from the largest CMS ecosystem in the world: tens of thousands of themes, plugins, and developer resources.
It also means WooCommerce stores can be anything from a small side project to a large-scale operation, which partly explains why it shows such high total store counts but lower representation among top-traffic sites.
Key WooCommerce Statistics (2025–2026)
Metric
Figure
Ecommerce platform market share (BuiltWith)
20.1%
Ecommerce store share (StoreLeads)
33.4%
Share among top 1M ecommerce sites
18.2%
Active stores (StoreLeads)
4.53 million
Websites with WooCommerce elements
6.5+ million
Cumulative plugin downloads
211+ million
Average daily downloads
~30,000
Annual store count growth
~6%
Estimated annual GMV
$30–35 billion
Available languages
66
WordPress themes compatible
1,500+
WooCommerce plugins (WordPress directory)
6,000+
WooCommerce extensions (official store)
700+ free and paid
GitHub contributors
1,100+
Cost
Free (open source)
WooCommerce Regional Breakdown
WooCommerce has a genuinely global footprint:
United States: ~245,000 sites
United Kingdom: ~24,000 sites
India: ~15,000 sites
Strong adoption across Europe (25–30% regional share) and emerging markets where cost sensitivity makes the free, open-source model attractive.
Shopify Market Share
Shopify leads the ecommerce platform space by most measures:
26.2% of all ecommerce websites (BuiltWith, 2025)
28.8% among the top 1 million ecommerce sites (BuiltWith, 2025)
10.32% of the global ecommerce platform market more broadly (Statista, 2025)
~29–30% of the US ecommerce software market — the clear domestic leader
That last point is important. Among high-traffic, high-revenue stores, Shopify punches well above its weight.
The platform dominates in the top 10K, top 100K, and top 1 million site categories, which suggests it’s the platform of choice for established, growing brands.
About Shopify
Unlike WooCommerce, Shopify is a standalone, hosted platform. You don’t need WordPress or any other CMS – it’s a self-contained system for building and running an online store.
Shopify also operates as a CMS, holding 6.2% of the total CMS market (second only to WordPress). But its core strength is ecommerce, and that’s where it focuses nearly all of its development effort and resources.
Key Shopify Statistics (2025–2026)
Metric
Figure
Ecommerce platform market share
26.2%
Share among top 1M ecommerce sites
28.8%
US ecommerce software market share
~29%
Active stores worldwide
4.8–6.5 million
US-based stores
~3–3.5 million
UK stores
~241,000
Countries served
175+
2024 annual GMV
$292 billion
2024 annual revenue
$8.88 billion
Cumulative GMV (all time)
$1 trillion+
2024 Black Friday / Cyber Monday sales
$11.5 billion
Shoppers who bought from Shopify merchants (2024)
875 million+
Average store conversion rate
1.4%
Top 10% store conversion rate
4.7%
Apps on Shopify App Store
13,000+
Shopify Plus stores
~76,600
Shopify Plus new launches
300+ per week
Mobile share of Shopify traffic
68%
Mobile share of purchases
79%
Shopify Growth Trajectory
Shopify’s growth over the last five years has been dramatic:
Year
Approximate Active Stores
2020
1.7 million
2021
2.1 million
2022
2.9 million
2023
4.4 million
2024
4.6 million
2025
4.8–6.5 million
The COVID-19 pandemic was a major accelerant. Between March 2020 and January 2022, over 2.5 million new Shopify sites went live, a 201% increase.
Revenue growth has been equally strong. Shopify posted $8.88 billion in revenue for 2024 (up 26% year-over-year), with Q2 and Q3 2025 each showing 30%+ growth.
The company is projected to exceed $12 billion in revenue by 2026.
Shopify’s Enterprise Push
Shopify Plus (starting at $2,300/month) has become a meaningful part of the business, with roughly 76,600 stores and 300+ new merchants launching weekly.
Major brands like Gymshark, Red Bull, Nestlé, Pepsi, Tesla, and LVMH run on Shopify, which contributes to its outsized presence among high-traffic sites.
WooCommerce vs Shopify: Head-to-Head Comparison
Category
WooCommerce
Shopify
Market share (BuiltWith)
20.1%
26.2%
Top 1M site share
18.2%
28.8%
Active stores
4.53M (StoreLeads)
4.8–6.5M
2024 GMV
~$30–35B (estimated)
$292B
Pricing model
Free (open source)
Paid subscription
Hosting
Self-hosted (BYO hosting)
Fully hosted
CMS dependency
Requires WordPress
Standalone
App / plugin ecosystem
6,000+ plugins + 50,000+ WordPress plugins
13,000+ apps
Enterprise tier
No official tier
Shopify Plus ($2,300/mo)
Primary strength
Flexibility, cost, WordPress ecosystem
Ease of use, scale, enterprise features
What the Numbers Tell Us
The market share data paints a nuanced picture. Here are my top takeaways:
Shopify dominates among high-traffic, high-revenue stores. Its lead in the top 1 million sites (28.8% vs 18.2%) and its massive GMV ($292 billion vs an estimated $30-35 billion) show that Shopify is where bigger, more established brands tend to land.
WooCommerce has broader total adoption. When you count all ecommerce sites (not just the biggest ones), WooCommerce’s numbers are comparable or even higher than Shopify’s. The free, open-source model makes it accessible to anyone with a WordPress site.
They serve different audiences. WooCommerce attracts merchants who want full control, already use WordPress, or are cost-sensitive. Shopify attracts merchants who want a managed, all-in-one platform and are willing to pay for convenience and reliability.
Neither platform is “winning” in an absolute sense – they’ve carved out different segments of a massive and still-growing market.
How to Choose the Right Platform
The right platform depends on your business, not on market share rankings. Here’s a practical framework:
WooCommerce is typically a better fit if you:
Already have a WordPress website
Want full control over your hosting, code, and data
Are comfortable managing (or hiring someone to manage) updates, security, and performance
Are working with a limited budget for platform fees
Need deep customization that goes beyond what a hosted platform offers
Shopify is typically a better fit if you:
Want a managed, all-in-one solution that handles hosting, security, and updates
Prioritize ease of use and fast setup
Are scaling quickly and need enterprise-grade infrastructure
Want access to Shopify’s native features (Shop Pay, Shopify Payments, POS)
Don’t want to manage the technical side of running an ecommerce site
Both Platforms Work Well with Mobile Apps
Regardless of which platform you choose, mobile is a critical channel.
68% of Shopify traffic comes from mobile devices, and 79% of purchases happen on mobile – numbers that are broadly consistent across ecommerce.
Both WooCommerce and Shopify integrate well with mobile app solutions like Vendrux, which lets you extend your existing store into a native iOS and Android app without rebuilding anything.
Whether you’re running a WooCommerce store on WordPress or a Shopify storefront, your full website experience, including all your integrations, customizations, and checkout flow, carries over into the app.
The ecommerce platform market continues to grow, and both Shopify and WooCommerce are growing with it.
Shopify leads in market share, GMV, and presence among top-tier merchants. WooCommerce holds strong with its WordPress ecosystem, global accessibility, and open-source flexibility.
The numbers will shift as the market evolves, but the core dynamic is clear:
Shopify is the go-to for merchants who want a managed, scalable platform.
WooCommerce is the go-to for merchants who want control, flexibility, and the WordPress ecosystem.
Together, they power the majority of ecommerce on the internet. And that’s unlikely to change anytime soon.
—
Statistics sourced from BuiltWith, StoreLeads, W3Techs, Statista, Omnisend, Marketplace Pulse, Shopify earnings reports, and Red Stag Fulfillment research. All figures reflect the most recent available data as of early 2026.
Many ecommerce brands try launching a mobile app, only to be disappointed with the results. They don’t see a return, adoption stalls, and within months the app is either neglected or written off as a failed experiment.
This negative sentiment spreads throughout the ecom community… and all of a sudden you get the impression from talking to other brand owners that apps don’t work.
The truth is: mobile apps can deliver exceptional results. Launching an app could be one of the best things you do for your business. The ROI potential is massive, as much as 53x for some of the brands we’ve worked with.
But at the same time, there are many “failed” apps out there. And there are very real reasons you could launch an app that doesn’t deliver the kind of results you are looking for.
Let’s explore the most common reasons ecommerce mobile apps fail, and how each one can be avoided with the right strategy, mindset, and support.
Too often, brands build an app but don’t promote it.
It’s not mentioned on the website. There’s no email, no SMS announcing the app. No incentive offered to download it. Then they wonder why no one’s using the app, and write it off as a failure.
Without visibility, even your most loyal customers won’t bother downloading it.
The fix: Build a real launch plan. Promote your app across every channel – your homepage, emails, SMS, Instagram, even QR codes on your product packaging. Offer clear benefits for downloading, like exclusive discounts or early access.
Once customers are in the app, they convert more often, spend more per order, and return more frequently. That’s ROI worth investing in from day one.
If your app looks and feels like a stripped-down version of your site (or worse, a generic app built from a template), there’s no reason for customers to use the app – since they can just get a better user experience, without downloading, on the web.
Poor UX kills adoption fast. Especially when you’re trying to sell customers on downloading something that’s missing key features and functionality compared to your website.
Rainbow Shops’ VP of Ecommerce, David Cost, said this regarding apps:
“The app needs to be at least as functional as the website. It doesn’t need to be better than the website, but the user experience can’t be worse.”
The fix: Make sure your app matches the quality of your website. With Vendrux, your app mirrors your website’s features, design, and experience – while adding the speed and convenience of a native app. There are no compromises, no features lost along the way.
3. Buggy, Broken, or Outdated Apps
Apps require constant maintenance. It’s a common misconception that you just need to build once, and never have to touch the app again.
Without active maintenance, your app becomes a liability. Bugs go unfixed. New OS versions break functionality. Features lag behind your website.
The result? Frustrated users, negative reviews, and an app that slowly declines until it dies… and the brand takes this to mean that apps don’t work.
The fix: When you’re building your app, choose a solution that keeps your app stable, up to date, and polished.
With Vendrux, your app stays synced with your website in real time, so your content and features are always up to date. More importantly, our team handles all technical upkeep, including updates for new iOS/Android releases, bug fixes, and quality assurance.
You don’t need to hire developers or constantly check for issues. We proactively manage your app so it just works, and keeps your customers coming back.
4. Ongoing Maintenance is a Burden
Perhaps you are keeping your app up to date, but doing so becomes like running a whole new business in and of itself.
Custom apps and many app builders come with hidden overhead. With custom apps, you’re either wrangling internal devs or coordinating with freelancers just to keep things working.
This is what Tobi found – their custom ecommerce app needed an in-house team of six just to maintain.
Then there’s the constant duplication of work with many app builders – making each update twice (once on your website, once on the app), which wears on your team over time.
For most brands, it’s just not sustainable.
The fix: Pick the right way to build an app. Don’t go with an option that creates more work. Vendrux handles your app’s maintenance, updates, and support. You manage everything from your existing site, with no new systems, no dev work.
Vendrux is a service, not just a tool. Our team acts as your mobile app department so you don’t have to build one internally. You save massively on overhead as a result.
5. You Spent Too Much to Build It
A very common issue is brands spending huge amounts of money on a custom app, and facing a steep uphill climb just to make back the money they invested.
If you spent $100,000 or more building your app, you need your app to really take off if you want to make a positive return. Even moderate usage looks like a failure.
The fix: Keep it lean. We don’t recommend ecommerce brands to invest in custom development. The cost is far too much, and the minimal benefits are just not worth it.
Vendrux helps you launch fully branded, premium apps for a fraction of the cost of custom development. Most brands recover the initial investment within weeks, thanks to increased conversion and engagement.
There’s simply no business case for spending six figures on an ecommerce app when you already have a solid mobile site.
6. Customers Forget About the App
You might get a decent number of downloads, but these customers are not guaranteed to keep using the app.
It’s easier than you think for someone to totally forget about your app. Most people have 50+ apps on their phone. Downloading an app is so easy that many people will download apps that end up buried and unused.
Once you get the initial download, it’s essential to have a strategy to keep users engaged.
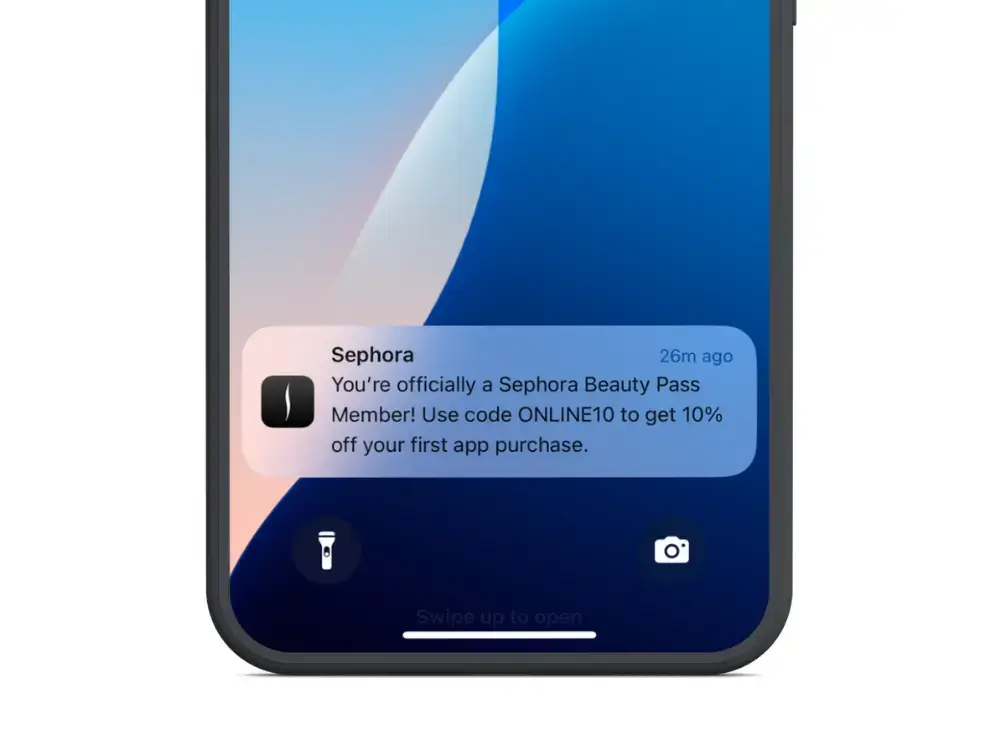
The fix: Actively drive engagement. Push notifications are great for this.
Many people see push as just a direct response channel, used for promotions and product launches, but it’s much more than that. Regular push notifications keep your brand (and app) top of mind, and build constant awareness that prevents it from being forgotten.
Send regular, non-pushy push notifications, especially in the early stages after download, when there’s the biggest drop-off in app retention.
Get more opt-ins, by communicating the value of push notifications upfront (and actually delivering that value), so you’re able to send push notifications to a higher percentage of your app users.
You need to ensure there’s a tangible benefit for customers to keep using the app long-term.
This often happens if you front-load download incentives (like a one-time discount on the first app purchase).
The result? Many shoppers download the app to get the discount, make a purchase, and then delete the app (or forget about it).
You’ll get some power users who prefer the convenience of the app, but your overall app retention rates lead you to believe that it’s a failure.
The fix: Build long-term value into your app. Offer app-only perks like early access to drops and promotions, app exclusives, or loyalty rewards. Make your best customers feel like insiders – part of an elite community.
Use push notifications wisely, too, to provide real value that users can’t get on the website; fast order updates and alerts, useful tips, priority notification about new sales and drops.
Learn more: Exclusivity marketing: how to use mobile apps and exclusive experiences for sustainable growth.
8. Your Brand Isn’t a Good Fit
Not every ecommerce business is a good match for a mobile app. A furniture store, for example, doesn’t make as much sense for an app as a fast fashion brand.
Mobile apps are great for brands with a high SKU count, high purchase frequency, strong impulse buy potential.
If you have low purchase frequency or a tiny product catalog, your audience may simply not need one.
The fix: Define your goals up front. Is your business the kind of business that could benefit from getting customers to browse your store more often, habitually open the app, and buy more often?
If not, you might be better served focusing on another area of your business.
9. Misaligned Expectations
Many brands think their app was a failure because they simply expected too much.
They thought it was supposed to double their revenue, or become their top sales channel.
Apps typically contribute less sales than a brand’s mobile and desktop sites, simply because there’s more friction involved in downloading the app. Most customers will make their first purchase on the website; an app is unlikely to be a major acquisition channel.
The fix: Set the right expectations. Mobile apps drive higher LTV, AOV, and retention among your top customer segment; usually your top 10-20% of customers.
So while there may be substantially fewer people using your app than shopping on your website, these customers generally give an outsized contribution to revenue (a brand might see 20% of total online revenue through their app, from just 10% of their customers, for example).
As long as you keep costs in check and avoid unnecessary complexity, a small but engaged app audience can produce outsized results (and a clear positive ROI).
Conclusion: Making Your Ecommerce App a Success
Ecommerce mobile apps are a powerful growth lever for brands. But they’re not a magic fix.
You need the right strategy to ensure that your decision to launch an app pays off. In summary, you need:
A clear app promotion strategy
A user experience at least as good as your mobile website (no missing features or inconsistencies)
Compelling reasons for customers (not all your customers – but your best customers) to keep the app downloaded
Strong early engagement, to keep your app and brand top of mind after someone downloads
A low enough investment (and overhead) to ensure a clear path to profitability
At Vendrux, we’ve helped thousands of brands turn their websites into high-performing mobile apps, with zero duplication of effort and full-service support from day one.
If you’re serious about unlocking retention, LTV, and mobile-driven revenue (without the risk, waste, or technical headaches) we’d love to show you how it’s done.
Just get a preview of your app, and you’ll be able to try out an interactive demo that shows you how well your existing site can function as a mobile app.
There’s no need to rebuild, no need to reinvent the wheel. Just replicate what already works for you, in a more convenient package, for your best customers.
Mobile devices now account for nearly two-thirds of all internet traffic worldwide.
As of early 2026, mobile represents 62-64% of global web traffic, with desktop holding roughly 35% and tablets making up the remaining 2%.
This isn’t a new trend; mobile surpassed desktop back in late 2016. But the gap continues to widen.
What’s changed is how that traffic behaves: where it comes from, what users do with it, and what it means for businesses trying to reach them.
This guide breaks down the latest mobile traffic statistics by region, country, and use case, plus what these numbers mean for ecommerce brands in particular.
Here’s the latest breakdown on mobile vs desktop internet traffic:
Device
Share
Mobile
62-64%
Desktop
35-36%
Tablet
1.8-2%
For context, in 2013 desktop held 79% of traffic versus mobile’s 16%. The reversal has been dramatic and shows no signs of slowing.
Key Milestones
2016: Mobile surpassed desktop for the first time
2018: Mobile reached 50.88% market share
2020: Mobile hit 55% during pandemic-driven usage spikes
2025: Mobile crossed 60% globally
2026: Mobile stabilizing at 62-64%
Mobile Traffic by Region
Not all regions use the internet the same way.
Mobile dominance varies significantly based on infrastructure, economics, and device preferences.
Let’s take a look at the data:
Region
Mobile Share
Desktop Share
Africa
79-84%
16-21%
Asia
71%
29%
South America
62%
38%
Europe
52-53%
45-47%
North America
50-51%
49-50%
Oceania
50%
50%
Why the Regional Differences?
Africa and Asia lead in mobile traffic because many users skipped desktop computing entirely.
Mobile phones were their first, and often only, way to access the internet. Infrastructure investments went straight to cellular networks rather than traditional broadband.
North America and Europe show more balance because desktop computing was already established before smartphones arrived.
Work cultures in these regions also favor desktop usage for productivity tasks.
Mobile Traffic by Country
Individual countries show even more dramatic variation.
Highest Mobile Traffic Share
Country
Mobile Share
Desktop Share
Sudan
89.6%
10.4%
Nigeria
83-86%
14-17%
India
72-80%
20-28%
Indonesia
70%+
30%
Brazil
65%
35%
More Balanced Markets
Country
Mobile Share
Desktop Share
United Kingdom
54%
46%
Australia
52%
48%
Japan
47%
53%
Canada
47%
53%
United States
43-47%
50-57%
Germany
42%
58%
China
33%
67%
Notable Observations
The US is an outlier among developed nations.
While most of the world has gone mobile-first, American internet usage remains nearly split between mobile and desktop.
Desktop still leads slightly, likely due to workplace usage patterns and larger home setups.
China’s desktop dominance is surprising.
Despite being a mobile-first market in many ways (mobile payments, super-apps), web traffic statistics show desktop leading.
This may reflect how Chinese users spend more in-app time (which isn’t always counted as “web” traffic) rather than browsing the open web on mobile.
Germany has the lowest mobile share among major developed economies at 42%, reflecting strong desktop work culture and privacy-conscious users who may prefer desktop browsing.
Mobile App vs Mobile Web
When users are on mobile, where do they spend their time?
Usage Type
Share of Mobile Time
Mobile Apps
88%
Mobile Web
12%
Users spend nearly 90% of their mobile time in apps, not browsers. This has major implications for businesses:
Discovery often happens on mobile web (Google searches, social media links)
Engagement happens in apps (longer sessions, repeat visits)
Conversion is significantly higher in apps
In-App Browsers
About 31% of mobile web sessions now happen through in-app browsers; when users click links within Instagram, Facebook, LinkedIn, or other apps.
These sessions use lightweight embedded browser views rather than Safari or Chrome directly.
Mobile Browser Market Share
When users do browse the mobile web, Chrome dominates.
Browser
Mobile Market Share
Chrome
65-67%
Safari
23%
Samsung Internet
3-4%
Opera
2%
Firefox
0.5%
Chrome’s dominance comes from being the default browser on Android devices (which hold ~70% of global smartphone market share).
Safari’s share comes entirely from iOS users, where it’s the default.
Mobile Internet Speeds
Mobile connections are getting faster, narrowing the gap with fixed broadband.
Global Average
Average global mobile download speed: 50-60 Mbps (2025)
Average global broadband speed: 97.3 Mbps (up 12.1% year-over-year)
Fastest Mobile Internet by Country
Country
Median Mobile Download Speed
UAE
546 Mbps
Qatar
517 Mbps
Kuwait
378 Mbps
South Korea
187 Mbps
Norway
160 Mbps
Singapore
120 Mbps
United States
100+ Mbps
5G Adoption
5G is accelerating mobile speeds globally:
2.8-2.9 billion 5G subscriptions worldwide (end of 2025)
55% of the world’s population now has 5G network access
5G is expanding 4x faster than 4G LTE did in its comparable period
By 2027, 5G is expected to overtake 4G as the dominant mobile technology
Regional 5G Penetration (2025):
North America: 79%
Northeast Asia: 61%
Western Europe: 55%
China: 1 billion+ 5G connections
Mobile Ecommerce: Traffic vs Conversion
Here’s where the data gets interesting for ecommerce brands.
The Traffic-Conversion Gap
Metric
Mobile
Desktop
Share of traffic
54-60%
40-46%
Conversion rate
1.5-2.9%
3.5-4.3%
Average order value
$112
$155
Mobile drives the majority of traffic but converts at roughly half the rate of desktop. This gap represents both a challenge and an opportunity.
Why Mobile Converts Lower
There are a few reasons why most ecommerce sites find lower conversion rates on mobile vs desktop:
Screen size: Harder to browse products, compare options, read reviews
Form entry friction: Checkout forms are painful on small screens
Trust perception: Users feel less secure making purchases on mobile
Research vs buy: Many users research on mobile, then purchase on desktop
There’s one solution to this, however; a mobile channel that converts at an even higher rate than desktop, in many cases.
How Apps Change the Equation
Native mobile apps close the conversion gap significantly:
Apps convert at 157% higher rates than mobile web
85% of US mobile shoppers prefer apps over mobile websites
Push notifications drive 3-10x higher engagement than email
Saved payment methods reduce checkout friction
This is why major retailers invest heavily in their mobile apps. They’ve found a way to capture mobile traffic while maintaining desktop-level (or better) conversion rates.
For ecommerce brands looking to capture mobile traffic more effectively, a native mobile app can transform how customers engage with your store.
Vendrux helps brands extend their existing website into native iOS and Android apps, without rebuilding their entire tech stack. Your website powers the app, and we add native app capabilities on top, which effectively turns your web store into a full-featured mobile app.
It’s the best way to build a mobile app, if you don’t want the cost and hassle of multiple codebases and expensive mobile development teams.
Native app development for iOS and Android means two separate codebases, two separate teams, and a price tag that typically starts at $100,000 per platform. For many brands, that math doesn’t work.
Hybrid mobile app development offers a different path. Instead of building two apps from scratch, you write one codebase using web technologies and deploy it to both platforms. Some approaches don’t even require writing new code at all.
But “hybrid” is one of the most misused terms in mobile development. Most articles lump together five architecturally different approaches under one label, which leads to confusion and bad decisions.
This guide defines each one clearly, explains how hybrid development actually works under the hood, and helps you choose the right approach for your situation.
How Does Hybrid App Development Actually Work?
A hybrid mobile app is a native application that renders its interface through an embedded browser engine instead of platform-native UI components. It looks and feels like a native app to the user, but under the hood, the interface is built with HTML, CSS, and JavaScript.
Three layers make this work:
The Native Container
A thin layer of platform-specific code (Swift for iOS, Kotlin or Java for Android) that handles the things only a native app can do: App Store packaging, push notification registration, device API permissions, and system-level integrations. This is what makes a hybrid app a “real” app that Apple and Google accept into their app stores.
The Embedded Browser Engine
Inside that native container sits a browser engine: WKWebView on iOS, Android WebView on Android. This engine renders your HTML, CSS, and JavaScript, but with the browser chrome (URL bar, tabs, navigation buttons) stripped away. The user sees a full-screen app interface, not a website.
Think of it like a high-quality picture frame (the native container) displaying a responsive website (the embedded browser engine). The frame gives you App Store distribution, push notifications, and a home screen icon. The content inside gives you the interface.
Hybrid apps keep your web experience at the core, then add native layers where they actually matter.
The Bridge
The bridge is what connects your JavaScript code to native device capabilities. When your app needs the camera, GPS, biometric authentication, or file system access, it calls a plugin that communicates through this JavaScript-to-native bridge.
Frameworks like Capacitor (Ionic’s native runtime) and Apache Cordova provide the bridge and a library of plugins that handle the most common native features. Capacitor offers 100+ official and community plugins covering push notifications, camera, geolocation, biometrics, and more.
This bridge is what separates a hybrid app from a mobile website. A website opened in Safari or Chrome can’t send push notifications, can’t appear on the home screen without a browser prompt, and has limited access to device hardware. A hybrid app, running inside a native container with a bridge to native APIs, gets all of that.
Hybrid vs Cross-Platform vs Native vs PWA: What’s The Difference?
An “app” can mean many things, and there are many different ways to build a mobile app. The best way to understand hybrid app development is to compare it to these other commonly used app development methods.
Here’s what’s involved with each approach:
Hybrid
Cross-Platform
Native
PWA
How it works
Web tech rendered in embedded browser inside native container
Shared code compiled to native components or custom rendering engine
Platform-specific code, platform-specific UI
Web app with service workers, runs in browser
Core languages
HTML, CSS, JavaScript
JavaScript (RN), Dart (Flutter), C# (MAUI)
Swift/Obj-C (iOS), Kotlin/Java (Android)
HTML, CSS, JavaScript
Key frameworks
Ionic, Capacitor, Cordova
React Native, Flutter, .NET MAUI, KMP
Xcode, Android Studio
None (browser APIs)
Performance
Good
Near-native
Best
Web-speed
App Store
Yes
Yes
Yes
Limited (no iOS)
Push notifications
Yes
Yes
Yes
Partial (limited on iOS)
New codebase
Yes (web-based)
Yes (framework-specific)
Yes (per platform)
No
Best for
Content apps, MVPs, internal tools
Complex apps, teams with RN/Flutter skills
Performance-critical, platform-specific apps
Simple web-based functionality
There’s one key distinction most articles get wrong: React Native and Flutter are not hybrid frameworks. They’re cross-platform frameworks. The difference is architectural.
Hybrid frameworks (Ionic, Capacitor, Cordova) render your interface through an embedded browser engine. Your code is HTML, CSS, and JavaScript displayed in a native-hosted browser.
Cross-platform frameworks (React Native, Flutter, .NET MAUI, Kotlin Multiplatform) either compile your code to native UI components (React Native) or use a custom rendering engine (Flutter uses Skia/Impeller). No browser engine involved.
The architecture you choose determines performance characteristics, developer requirements, and maintenance patterns.
It also determines the cost and time it takes to build and launch your app. More complex architecture means more dev hours needed, which means a higher cost, and also means more complexity and cost to maintain.
What Are the Advantages of Hybrid App Development?
Hybrid development solves a core problem with mobile apps: the cost of building and managing multiple platforms with separate codebases.
Hybrid apps let you reach users on iOS, Android, and often the web, all with a lot of the same code. This makes it quicker and cheaper to build, and easier to maintain.
Here are the top benefits of building your app this way:
Lower development cost
Framework-based hybrid development typically costs significantly less than fully native development. There’s less code to write, less duplication, and thus fewer billable hours to go from idea to launch.
Faster time-to-market
As mentioned above, you can go live faster. Not only does that mean a lower cost, it also means it’s sooner you’re able to start earning revenue from your app.
Wider developer talent pool
JavaScript is the most widely used programming language in the world. Hybrid development is a lot closer and a lot easier to understand for traditional web developers, meaning you’ll likely have a wider pool of developers to choose from, compared to native apps requiring specialized native iOS and Android developers, who are scarcer and typically charge more.
Full App Store and Google Play distribution
Unlike PWAs, hybrid apps get full app store presence: search visibility, ratings and reviews, automatic update distribution, and the trust signal of being a “real” app that customers can download and keep on their home screen.
Native device features
Also unlike PWAs, hybrid apps can tap into some native device features (e.g. native push notifications). Plugin ecosystems like Capacitor’s 100+ plugins bridge the gap between web capabilities and native device APIs.
Simpler maintenance
You have one codebase to maintain for iOS and Android. Depending on your architecture, that may also include your website as well, in which case you could update once (your website) and see your changes go live on the web, Android and iOS simultaneously.
What Are the Limitations of Hybrid Apps?
Hybrid apps have real limitations. But they’re narrower than most articles suggest, and for the majority of business use cases, they don’t materially affect the end user experience.
Performance ceiling for graphics-heavy apps
Rendering through an embedded browser engine adds overhead compared to native UI. This matters for games, AR/VR experiences, real-time video processing, and apps with complex custom animations. It doesn’t meaningfully affect ecommerce stores, content apps, business tools, or any app where the interface is primarily text, images, forms, and navigation.
Platform-specific features may lag
When Apple or Google ships a new OS feature (iOS Live Activities, Android’s foldable display support), native apps get same-day access. Hybrid apps wait for plugin or framework updates, which can take weeks or months depending on the feature.
Browser engine inconsistencies
WKWebView on iOS and Android’s WebView don’t render identically in every edge case. CSS rendering quirks, scroll behavior differences, and JavaScript execution timing can vary. Thorough cross-device testing catches most issues, but it’s an ongoing consideration.
Plugin dependency
Native device access relies on third-party or framework-maintained plugins. If a plugin is abandoned or poorly maintained, you inherit that maintenance burden. Capacitor’s ecosystem is healthier than Cordova’s (and still actively maintained by the Ionic team), but the dependency risk exists.
Not the right choice for every app
Games, AR/VR, real-time collaboration tools, and apps requiring heavy GPU processing should go native or use a compiled cross-platform framework like Flutter or React Native.
—
For context: these limitations affect a relatively small slice of app use cases. Many apps don’t require high-end performance or deep native capabilities. With ecommerce apps, for example, as well as content sites and many SaaS companion apps, the user is unlikely to notice any meaningful difference in performance between hybrid vs native.
This is why many of the world’s biggest apps use hybrid architectures in some way – because Gmail and Amazon don’t need that much more than what’s already possible on the web.
What Are the Best Frameworks for Hybrid App Development?
The right framework depends on which category of mobile development you actually need. Here’s how the major options break down, grouped by architecture.
True Hybrid Frameworks
These frameworks are what’s commonly used to build true “hybrid” apps.
Ionic + Capacitor is the dominant hybrid framework in 2026. Ionic provides the UI component library, and Capacitor (which replaced Apache Cordova as the native runtime layer) handles the bridge to native device APIs. The Ionic ecosystem has over 5 million developers and powers apps for Southwest Airlines, Burger King, Shipt, and H&R Block. Open source, with enterprise support available.
Apache Cordova is the original hybrid framework, dating back to 2011 (originally PhoneGap, developed by Adobe). Still functional and widely used in legacy projects, but declining. Capacitor is the successor for most new development. If you’re starting a new project, start with Capacitor.
Framework7 is a lightweight alternative focused on delivering iOS and Material Design look-and-feel. Good for simpler apps where you want native-feeling UI without a heavy framework. Smaller community and ecosystem than Ionic.
Cross-Platform Frameworks
People often refer to hybrid and cross-platform interchangeably; so in some cases, you’ll find people refer to these frameworks in the context of hybrid app development.
React Native (Meta) compiles JavaScript and React components to native UI elements. It does not use a browser engine. Used by Instagram, Discord, Bloomberg, and Shopify POS. Largest cross-platform ecosystem and the highest hiring demand among cross-platform frameworks.
Flutter (Google) uses its own rendering engine (Skia/Impeller) to draw every pixel on screen. Also not browser-based. Used by BMW, Alibaba, and Google Ads. The fastest-growing cross-platform framework, with a strong developer experience and a single language (Dart) for UI and logic.
.NET MAUI (Microsoft) is the successor to Xamarin. Compiles C# to native code. Used by UPS Mobile and NBC Sports Next. Best for teams already working in the .NET ecosystem who want to leverage existing C# skills.
Kotlin Multiplatform (KMP) (JetBrains) lets you share business logic in Kotlin across platforms while writing native UI per platform. Rising rapidly, especially among teams with existing Kotlin expertise. Netflix uses KMP for shared logic across its mobile apps.
Hybrid App Services
There’s a final category – managed services that utilize the same kind of hybrid approach, combining web and native elements to build your app, but without the technical lift required from frameworks like Ionic and Capacitor.
Vendrux converts your existing website into native iOS and Android apps. There’s no new codebase, no framework to learn, no separate development team.
Your website is the app. Updates to your site flow through automatically. Vendrux’s team handles the App Store submission, push notification infrastructure, and ongoing technical maintenance.
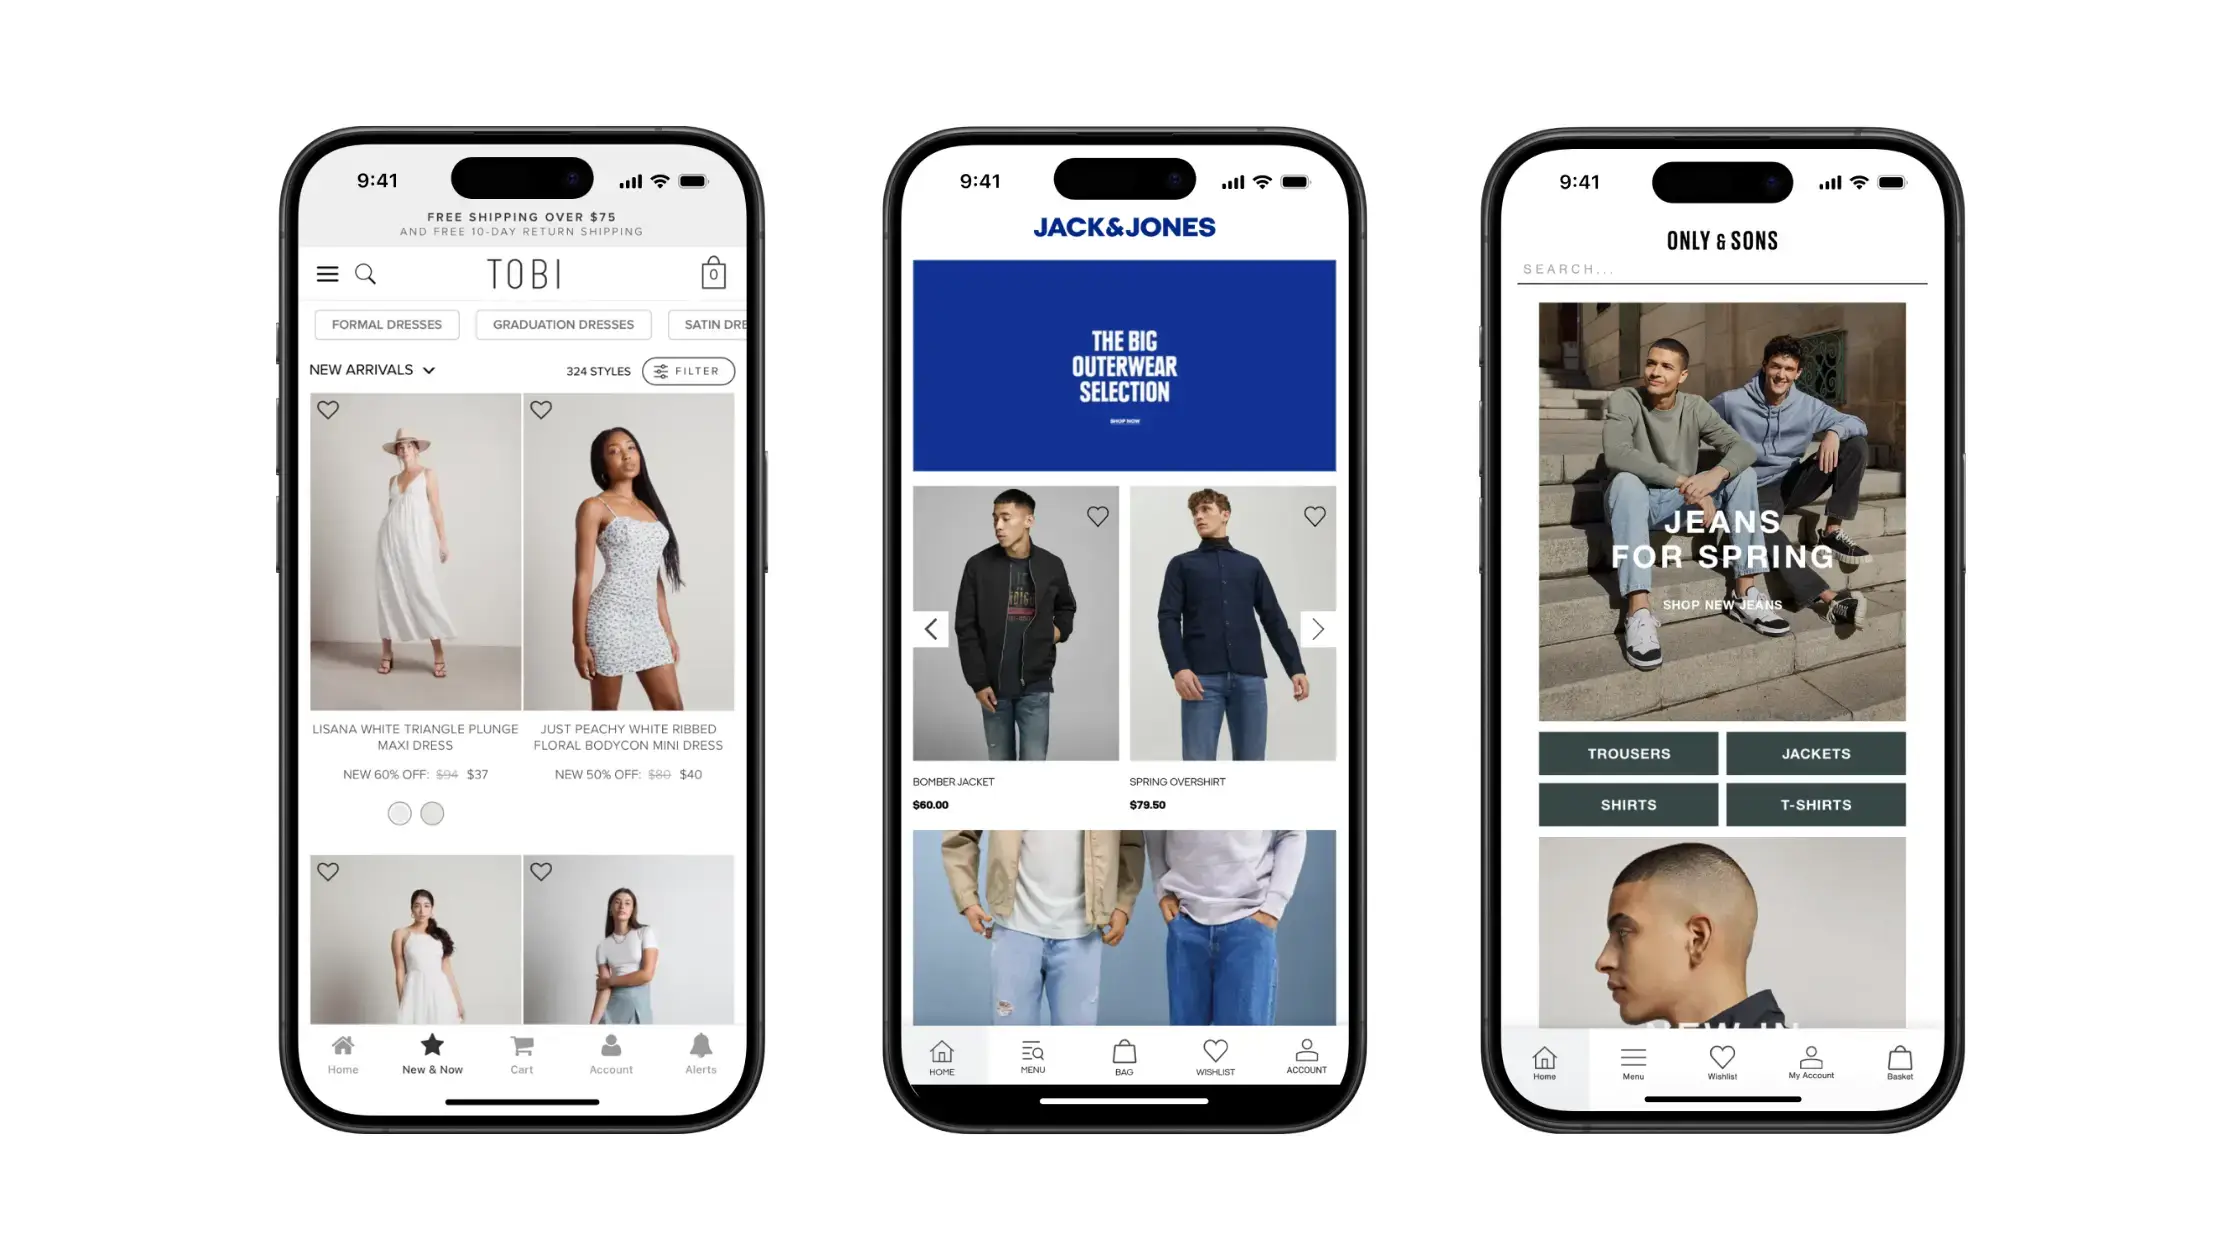
Some of the apps built with Vendrux
This is one of the best ways for ecommerce stores, in particular, to go live with their own mobile apps, while keeping the cost and technical complexity to a minimum.
“I liked the fact that you guys were able to duplicate the website into an app, and actually make it look like an app, with real app features. That was what made me choose Vendrux.” – – Raphael Faccarello, Head of Ecommerce, Yon-Ka Paris
Hybrid app development typically costs $20,000-$100,000 for a framework-based build, compared to $50,000-$250,000 per platform for native development, according to industry benchmarks.
But initial build cost is only part of the picture. What matters is total cost of ownership over the life of the app.
The initial build typically accounts for only 30-40% of total cost of ownership. The rest comes from ongoing maintenance: OS compatibility updates, plugin upgrades, feature additions, bug fixes, and developer hiring. Maintenance typically runs 15-20% of the original build cost annually.
Over five years, a $75,000 hybrid build becomes $130,000-$150,000 once you factor in maintenance. A $200,000 native build (for one platform; double it for two) becomes $450,000+.
A managed website to app service like Vendrux bundles maintenance into the subscription. OS updates, app store compliance, and ongoing technical support are handled for you, which makes total cost more predictable and typically lower than any build-from-scratch approach.
Approach
Initial Build
Timeline
Annual Maintenance
Native (2 platforms)
$100K-$500K
6-12 months
15-20% of build cost
Hybrid (framework)
$20K-$100K
3-6 months
15-20% of build cost
Cross-platform
$30K-$150K
3-8 months
15-20% of build cost
Vendrux
Setup fee + $1,499/mo
6-8 weeks
Included
When Should You Choose Hybrid Over Native or Cross-Platform?
The right approach depends on four things: what your app needs to do, what you already have, your budget, and your timeline.
For performance-critical apps, such as gaming, AR, video streaming, native development is typically required. You need the power, and users will notice the difference.
For relatively complex apps, designed to provide a standalone app experience (i.e. built app-first; an app to control headphone settings, a meditation app, a messaging app), a cross-platform framework may be best.
For many more straightforward apps – even standalone apps, internal business tools – hybrid development is typically best, because they’re easier and more affordable to build and maintain.
For web-first brands, looking to extend what they’ve already built into a mobile app (ecommerce brands in particular), a managed approach like Vendrux is the best option.
Vendrux’s web-to-app approach turns your existing site into a native app without a new codebase, a new team, or a new development cycle. For ecommerce brands this is the best and most cost-effective path to the App Store and Google Play.
“When I heard about Vendrux and that we could turn our website into a native app without additional development resources, it made perfect sense.” — Steven Kachtan, CIO, buybuyBaby
Examples of Successful Hybrid and Web-to-App Projects
Hybrid and web-to-app development powers apps across industries, from consumer brands to enterprise.
Burger King built its consumer food ordering app using Ionic, delivering order-ahead, in-store pickup, and loyalty rewards on both iOS and Android from a single codebase. One of many high-traffic consumer apps that run on hybrid architecture.
Bloomberg uses a cross-platform approach to serve millions of professional users with financial data, news, and real-time market information across both platforms. A good example of cross-platform at enterprise scale, where shared code reduces the burden on a large engineering organization.
Pharmazone, an online pharmacy on Shopify, used Vendrux to turn their existing website into native iOS and Android apps. The app launched in under two weeks and now generates 63% of Pharmazone’s total online revenue. Push notifications, App Store presence, and native app features, all built on top of their existing Shopify store.
Southwest Airlines uses Ionic for its mobile app, handling boarding passes, flight check-in, and booking across both platforms. Proves that hybrid architecture can handle mission-critical, high-frequency consumer functionality.
Building a hybrid app follows six stages, from requirements through App Store launch. Framework-based builds typically take 3-6 months; web-to-app can be done in 2-4 weeks.
Define requirements and choose your approach. What does your app need to do? What do you already have (an existing website, a design system, a backend)? Use the decision framework above to determine whether hybrid, cross-platform, or web-to-app fits best. This decision shapes everything downstream.
Set up the development environment. For framework-based hybrid development: install Node.js, the framework CLI (e.g., npm install -g @ionic/cli), and the platform SDKs (Xcode for iOS, Android Studio for Android). For web-to-app: connect your website to Vendrux’s platform. No local development environment needed.
Build the interface. For framework-based builds, this means creating HTML, CSS, and JavaScript components using Ionic’s UI library or your own design system. For cross-platform, you’ll write in the framework’s language (JSX for React Native, Dart for Flutter). For web-to-app, your existing website is the interface.
Integrate native features. Add plugins for push notifications, camera access, biometric authentication, deep linking, and offline caching. Capacitor and Cordova provide plugin libraries for common native features. Web-to-app platforms handle native integration on your behalf.
Test across devices and platforms. Test on real iOS and Android devices, not only simulators. Check browser engine rendering consistency, plugin behavior across OS versions, offline mode, push notification delivery, and deep link routing. Plan for differences between how WKWebView on iOS and Android’s browser engine handle edge cases.
Submit to App Store and Google Play. Prepare app store screenshots, descriptions, privacy policy links, and content ratings. Apple’s review process takes 1-7 days. Google Play review takes hours to a few days. Plan for potential rejection and revision cycles, especially on Apple’s side where review guidelines are stricter.
Mobile apps without the hassle
Even hybrid app development via Ionic/Capacitor is no simple task.
Vendrux gets you to the same result, much faster, much cheaper, and with less technical complexity. For web-first brands, it’s just better.
If you’ve read this far, you likely fall into one of two camps: either you’re a developer evaluating frameworks for a build, or you’re a business leader trying to figure out the fastest, most practical way to get a mobile app.
If you’re in the second camp, and you already have a website that works well on mobile, the answer may be simpler than you think. Vendrux turns your existing website into native iOS and Android apps, with push notifications, App Store distribution, and a team that handles the build, submission, and ongoing maintenance for you.
No framework to learn. No new codebase. No separate development team.
Get a free app preview to see what your website looks like as a mobile app. You’ll get an idea of what’s possible, why you really don’t need a custom build, and get a concrete picture of what it takes to go live with your own, branded mobile app.
Most ecommerce platforms are built as a single, tightly bundled system. Shopify, BigCommerce, WooCommerce: they all work this way out of the box. Pick a theme, customize within the platform’s boundaries, manage everything in one place.
That model works well until it doesn’t.
At some point, growing brands run into limits: the checkout can’t be customized past a certain point, the page builder won’t support a new layout, or launching a mobile app means starting from scratch because the platform was only designed to serve a website.
Headless ecommerce is the architectural response to those limits. This guide covers what it actually is, how it works, where it shines, and where it creates problems you didn’t have before.
What Is Headless Ecommerce?
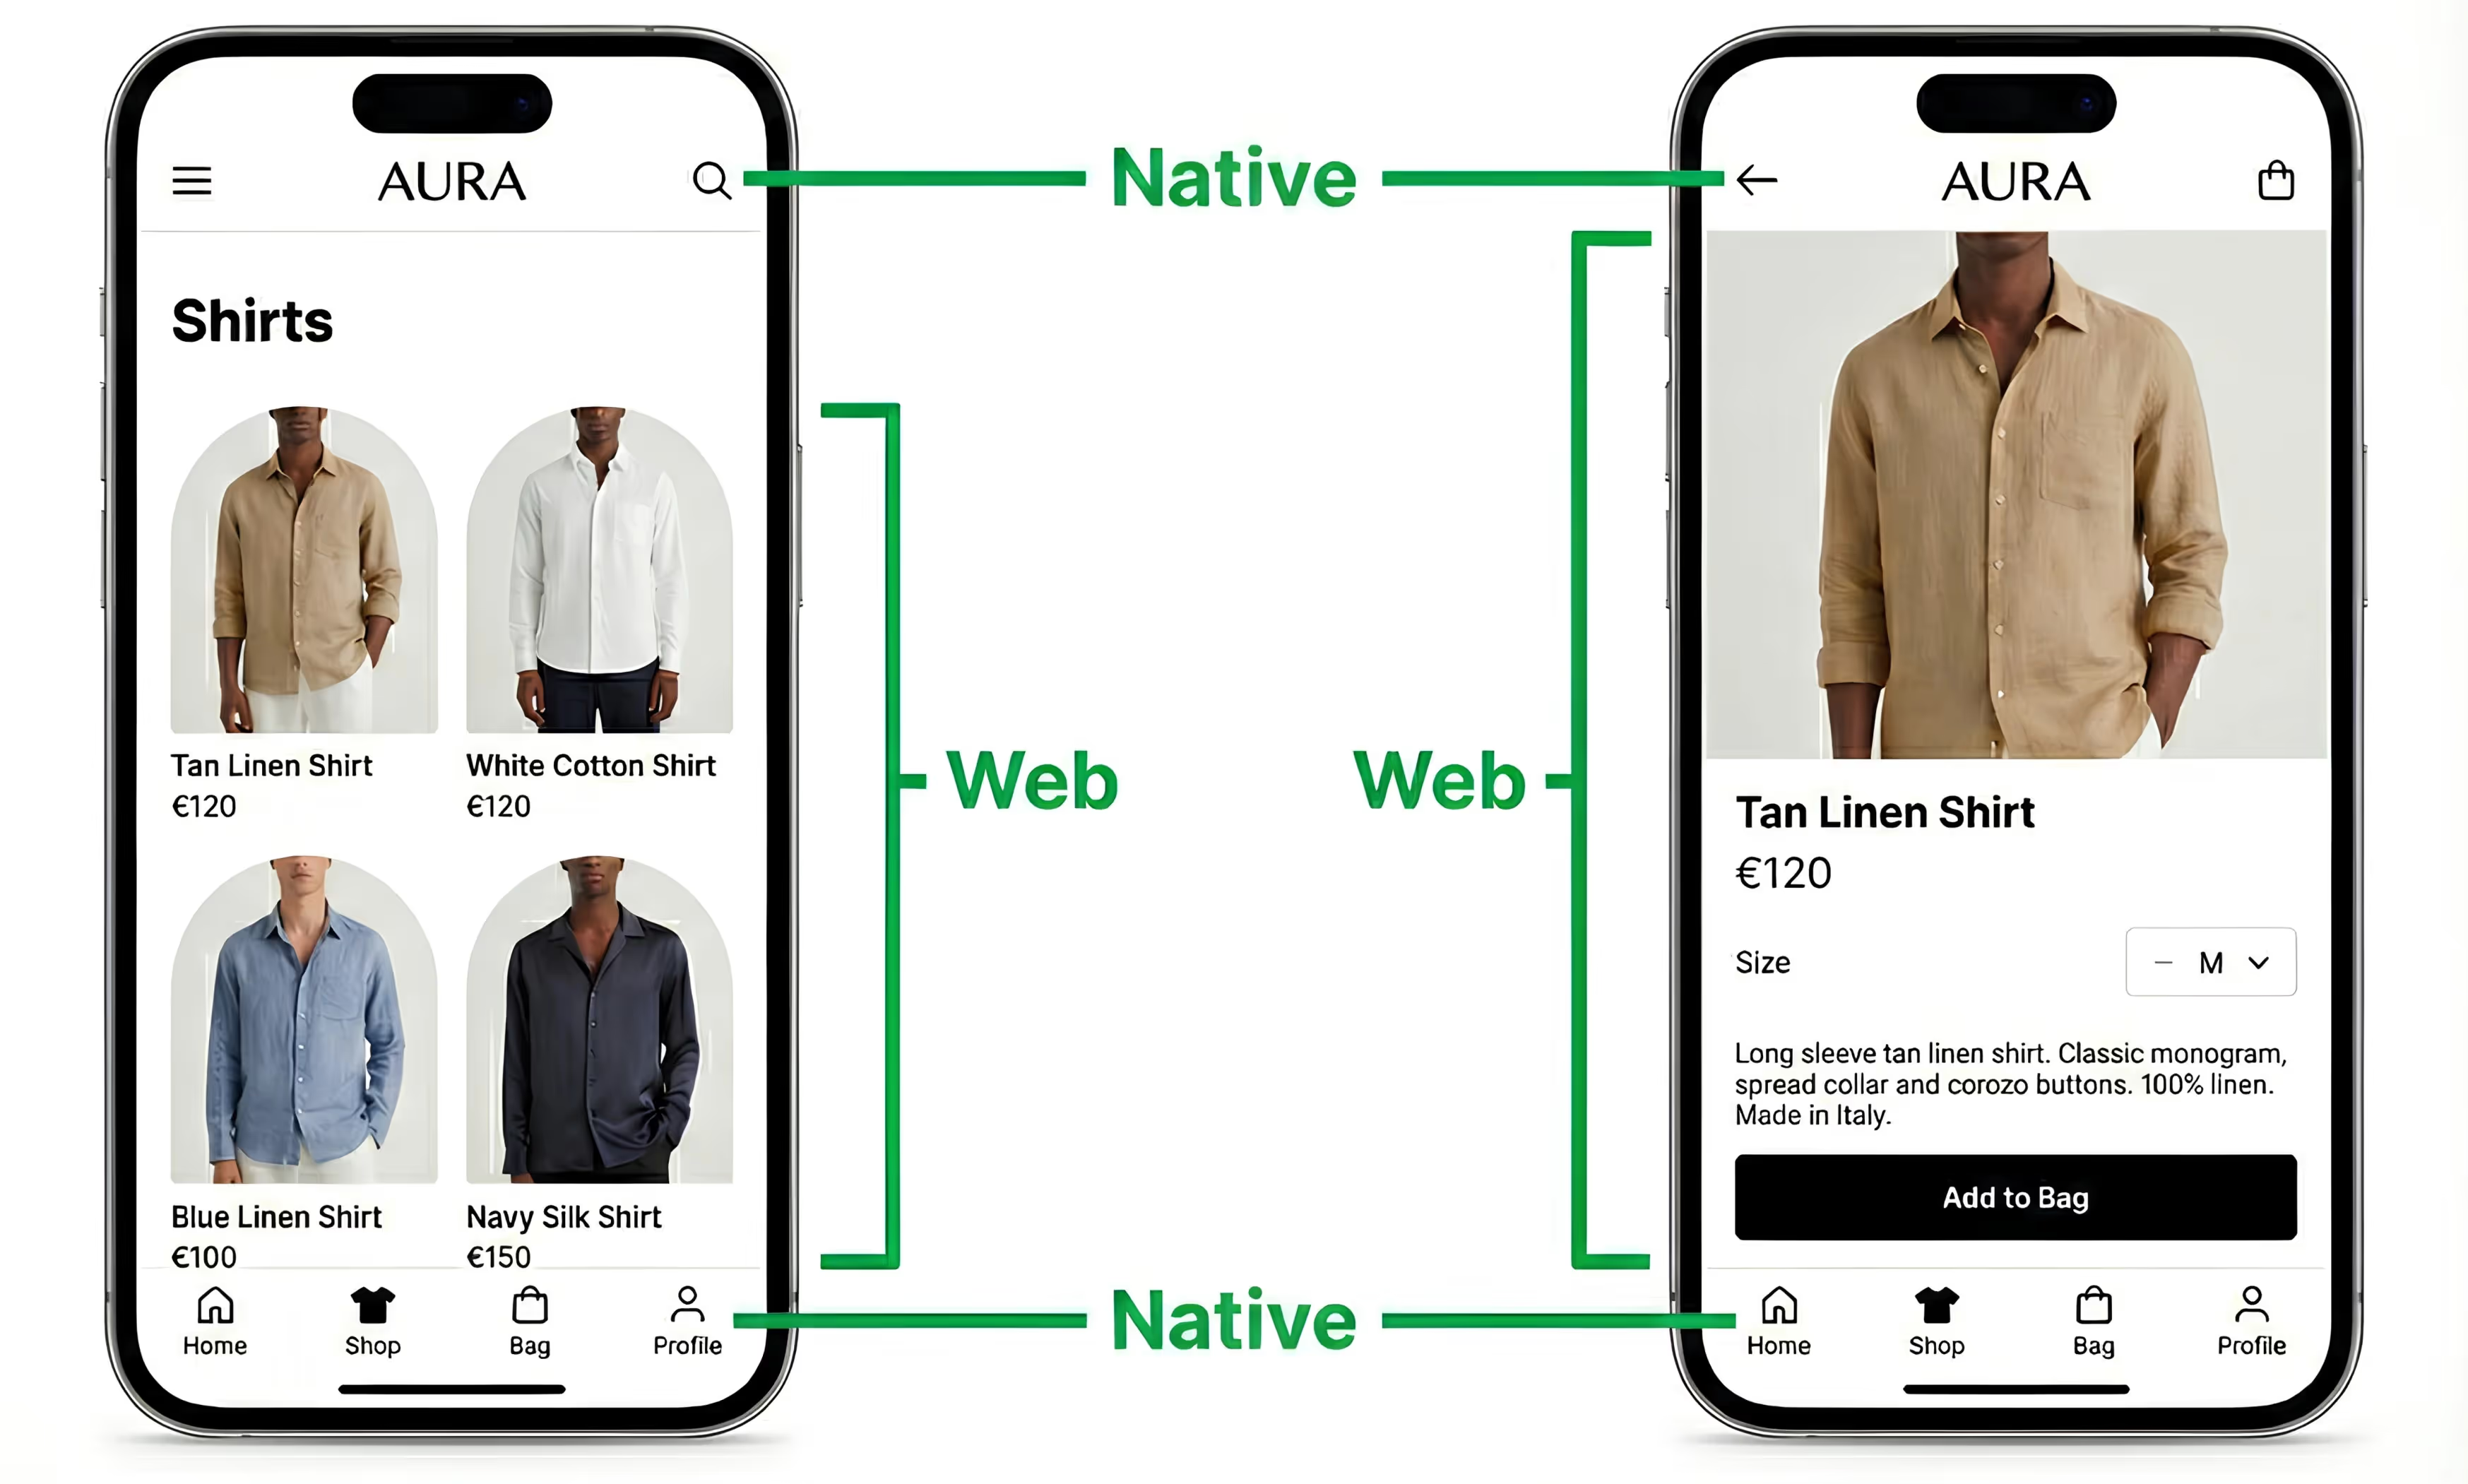
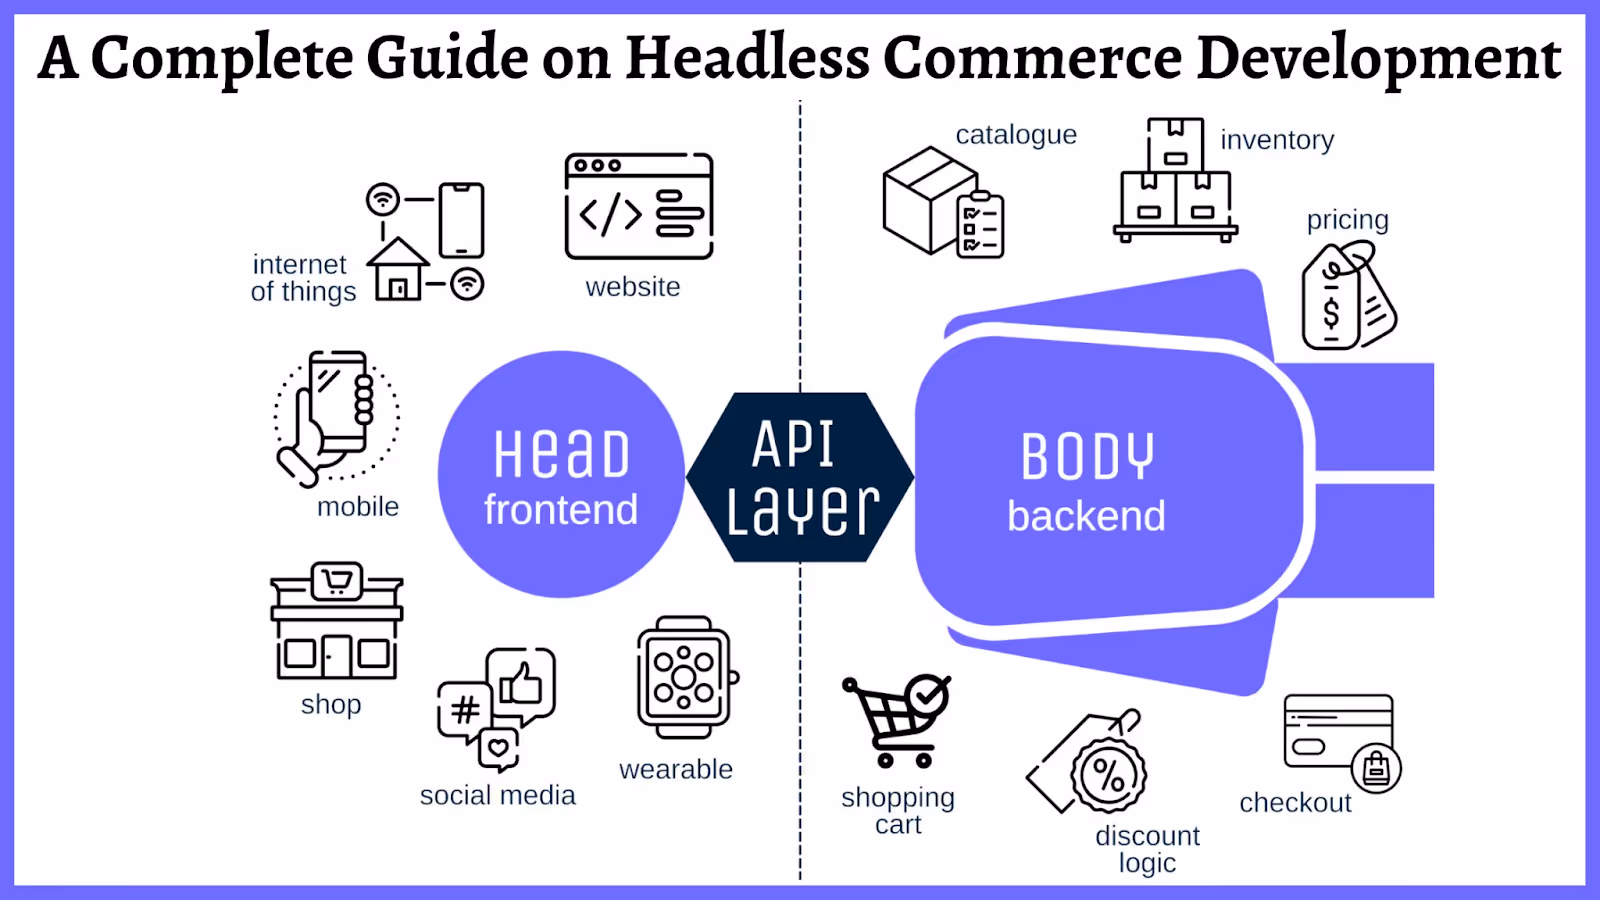
Headless ecommerce (or headless commerce) decouples the frontend of your store (the storefront customers interact with) from the backend (the commerce engine that handles products, inventory, pricing, orders, and payments).
The two layers communicate through APIs instead of being wired together in one system.
In a traditional setup, the backend dictates what the frontend can do. Your storefront is a layer of the platform itself, built within its templating system.
In a headless setup, the backend provides data and functionality through APIs, and the frontend can be anything: a custom React website, a native mobile app, a voice interface, a kiosk in a physical store. The commerce engine doesn’t care how the data is displayed. It just delivers it on request.
This separation is what makes headless flexible. Your developers aren’t constrained by a platform’s theme editor. They can build exactly the experience they want, with whatever frontend technology makes sense for the channel.
Headless vs Traditional: At a Glance
Traditional
Headless
Architecture
Frontend + backend are one system
Frontend + backend are separate
Customization
Limited to platform themes
Build any frontend you want
Channels
Primarily web
Web, apps, IoT, social, in-store
Dev requirements
Lower (platform handles most)
Higher (need frontend devs)
Time to customize
Faster for basic changes
Slower initially, faster ongoing
How Headless Commerce Works
On a technical level, APIs (Application Programming Interfaces) act as messengers between the backend and whatever frontends you build.
Here’s the simplified breakdown:
A customer visits your store (on web, in your app, or through another channel)
The frontend sends a request to the backend via API: “Show me the products in ‘New Arrivals’”
The backend processes the request and returns the data: product names, prices, images, inventory status
The frontend receives that data and renders it according to its own design
This happens for everything: product pages, search results, cart updates, checkout, order tracking. Every interaction between the customer-facing experience and the data layer goes through APIs.
The practical upshot of this is you can run multiple frontends off the same backend. Your website, your iOS app, your Android app, and your in-store displays all pull from the same product catalog, share the same inventory, and process orders through the same system.
Update a price in the backend and it’s reflected everywhere, instantly.
This is the primary reason brands go headless. You’re no longer limited to what a theme editor allows.
A completely custom product page layout
An unconventional checkout flow
An interactive lookbook that doesn’t fit any template
All this is possible when your frontend is decoupled from the commerce engine.
This matters most for brands where the shopping experience is the differentiator, like luxury, fashion, lifestyle brands where a generic storefront undermines the brand often hit the template ceiling first.
Better Performance
When the frontend is built independently, developers can optimize it specifically for speed.
They’re not loading an entire platform’s framework just to render a product page. Modern frontend frameworks (Next.js, Nuxt, Remix) enable static generation, edge caching, and code splitting that are difficult or impossible within traditional platform themes.
The performance impact compounds at scale. Google’s research on Core Web Vitals consistently shows that faster page loads correlate with higher conversion rates and lower bounce rates.
True Omnichannel Delivery
Traditional platforms are built for one primary channel: the web. If you want a native mobile app, you either build it from scratch or use a service that connects to your backend separately.
Headless makes omnichannel native to the architecture. The same commerce engine powers your website, your mobile apps, your in-store displays, and whatever channel comes next. One product catalog, one inventory system, multiple storefronts.
This is where headless delivers the most long-term value. As commerce expands beyond the browser (into apps, voice, social, and physical retail), having an API-first backend means you can meet customers on new channels without rebuilding your infrastructure each time.
Scalability
API-based architectures handle traffic spikes differently than monolithic platforms. Because the frontend and backend are separate, you can scale each independently. A surge during a product drop or flash sale? Scale the frontend delivery layer without touching the backend.
For brands running on cloud infrastructure, this means more efficient resource allocation and more graceful handling of peak traffic.
Technology Freedom
Headless doesn’t lock you into one vendor’s ecosystem. You can swap your CMS without touching your commerce engine. You can rebuild your frontend in a different framework without migrating product data. Each component of your stack can be upgraded independently.
This is the foundation of composable commerce: the idea that your tech stack is assembled from best-in-class components rather than relying on one platform to do everything.
Challenges of Going Headless
Headless isn’t a universal upgrade. It comes with real tradeoffs that make it the wrong choice for many brands.
Higher Complexity
With a traditional platform, one vendor handles everything. With headless, you’re managing multiple systems: a commerce engine, a CMS, a frontend framework, potentially separate services for search, payments, and personalization.
Each integration point is something that needs to be built, maintained, and monitored.
This isn’t insurmountable, but it requires either an in-house technical team or reliable agency partners. Brands without developer resources shouldn’t go headless.
Higher Upfront Cost
Building a custom headless frontend costs more upfront than using a platform’s built-in templates. Depending on the complexity, a custom headless build can run from $50,000 to well over $500,000 for enterprise implementations.
That’s before factoring in the headless CMS, search, personalization, and other services that a traditional platform bundles in.
The cost equation shifts over time. Headless typically reduces the cost of ongoing changes and new channel launches. But the initial investment is significant, and you need enough revenue to justify it.
Content Management Gets Harder
In a traditional setup, your marketing team edits pages and updates banners through the platform’s built-in editor. In headless, content management usually requires a separate headless CMS, and the editing experience depends entirely on how well it’s set up.
Some headless CMS platforms (Builder.io, Contentful, Sanity) offer visual editing that approaches the ease of traditional platforms. But it’s an additional system to configure, maintain, and pay for.
Mobile App Delivery Isn’t Automatic
Going headless solves the web frontend problem. It does not automatically give you a native mobile app.
Your headless backend can absolutely power an app (the APIs are there), but someone still needs to build, submit, maintain, and update that app on iOS and Android.
This is where many headless brands stall when it comes to launching the last piece of their omnichannel strategy. They build the core infrastructure, but realize that building and managing multiple frontends is a lot more costly and complicated than expected.
Headless Commerce in Practice
Brands across categories have adopted headless for different reasons – some of these brands among the world’s biggest merchants.
Nike rebuilt its digital experience on a headless architecture to support personalized, market-specific storefronts across dozens of countries, all powered by the same backend. The performance and personalization gains directly supported their shift toward direct-to-consumer sales.
Target uses a headless approach to unify its web, app, and in-store experiences. The same commerce backend powers product data, pricing, and inventory across channels, which is critical for services like same-day pickup and delivery.
Burberry went headless to deliver the kind of immersive, editorial shopping experience that luxury brands need but traditional ecommerce templates can’t support.
Who Should Consider Headless Ecommerce?
Headless makes sense when:
You’ve outgrown your platform’s templates. Your brand needs custom experiences that can’t be built within a theme editor or page builder.
You’re selling across multiple channels. Web, mobile app, marketplace, in-store, and you need them all pulling from the same backend.
You have developer resources (in-house or agency) to build and maintain custom frontends.
Your revenue justifies the investment. Most brands that benefit from headless are doing $10M+ annually. Below that, the ROI rarely justifies the added complexity.
You want to own your frontend roadmap. If you’re tired of waiting for platform updates or workarounds, headless puts the pace of innovation in your hands.
Headless probably isn’t right if:
You’re early-stage and still iterating on product-market fit
Your team doesn’t include developers (and you don’t want to hire an agency)
A traditional platform meets your current and near-term needs
You’re looking for simpler, not more complex
Popular Headless Ecommerce Platforms
The platform you choose as your headless backend matters. Some are built headless-first; others are traditional platforms that now offer headless capabilities.
If you’re evaluating whether to go headless, here are some tips for how to decide if it’s the right move; and to set yourself up for success.
Audit your current limits. What’s actually holding you back? Is it frontend customization, performance, multi-channel delivery, or something else? Your constraints should drive the architecture, not the other way around.
Choose your commerce engine carefully. This is the most consequential decision. Migrating commerce platforms later is expensive and disruptive. Pick one that matches your scale and team.
Plan for mobile from day one. Modern brands need an app. A done-for-you service like Vendrux can launch a native app from your headless storefront in weeks, while a custom build takes months. Plan the channel strategy upfront.
Build incrementally. You don’t have to go fully headless overnight. Many brands start by decoupling one part of their frontend (like the product page or checkout) and expanding from there. This reduces risk and lets you validate the approach before committing fully.
Headless can be a great way to build and maintain flexibility in ecommerce. It’s not everything, and it’s not always the way to go. Assess the options and weigh up for your own store whether or not this makes sense.
Customer Retention Rate means the percentage of customers who continue to do business with you over a given time period.
For ecommerce and direct-to-consumer (DTC) brands, this metric reveals how effectively you convert one-time shoppers into repeat customers.
A high retention rate indicates stronger customer relationships. For ecommerce businesses, retention is crucial for sustainable growth. Many top brands now prioritize retention over acquisition, because of retention’s clear impact on profit-led growth.
Vendrux helps ecommerce brands build mobile apps that drive higher retention rates, with minimal effort and investment. Want to learn how? Start with a free preview of your app now.
Why Does Customer Retention Matter in Ecommerce?
Customer retention drives profitable growth and long-term business health.
Acquiring new customers is expensive; often 5× more costly than keeping existing ones.
Often become brand ambassadors, referring others to your brand
Although repeat buyers might represent a minority of your total customers, they generate disproportionate value.
Gorgias found that repeat shoppers make up only 21% of the average brand’s customers, but drive 44% of revenue.
Ecommerce leaders like Glossier and Allbirds understand this dynamic. These brands cultivated communities and emotional connections that keep customers engaged beyond the first sale. Their loyal customers provide valuable feedback, positive reviews, and buzz on social media.
Improving retention creates a virtuous cycle: more repeat sales, higher LTV, stronger loyalty, and less reliance on constant spending to get new customers.
Key Retention Benchmarks for Ecommerce
In ecommerce, customer retention rate is typically calculated as:
Retention Rate = ((# of customers at end of period – # acquired during period) ÷ # of customers at start of period) × 100%
For example, if you start the quarter with 1,000 customers and end with 900, having added 100 new customers in that time, your retention rate is (900–100)/1000 = 80%.
Many ecommerce brands also track Repeat Purchase Rate – the percentage of customers who make more than one purchase. This is often an easier way to track retention for non-subscription businesses.
Average retention rates in ecommerce are typically lower than other industries. Industry benchmarks are around 30%, meaning only about 3 in 10 customers return to buy again within the measured period.
Beauty & Cosmetics: ~26% average repeat purchase rate
Fashion & Apparel: ~25% repeat rate
Health & Supplements: ~29% repeat rate
Grocery/Pet Supplies: often 50%+ (highest categories)
Luxury Goods: as low as ~10% repeat within a year
These benchmarks highlight that “good” retention is context-dependent.
For a premium one-off product brand, a 20% repeat rate might be solid. However a daily-use product brand might aim for 50%+.
There is a direct link between retention and customer lifetime value. Higher retention causes higher LTV.
Studies show that after one purchase, there’s only a 27% chance a customer will return. But once they make a third purchase, the chance of another jumps to 54%.
This shows the importance of the initial retention loop: getting a second and third purchase dramatically increases a customer’s long-term value to the business.
How Do Ecommerce Apps Impact Retention?
Mobile apps are a strong tool for improving retention, as a dedicated channel to engage customers post-purchase.
Apps enable push notifications – a powerful way to stay in touch with customers in real time. You can send useful, timely nudges such as:
Push notifications have the potential to significantly increase repeat visits and purchases. The key is relevance and timing.
Many successful brands use push as a retention lever. For example, Gymshark‘s shopping app sends alerts for exclusive “app-only” product drops, tapping into customers’ fear of missing out and driving repeat traffic.
You can see more examples of brands successful using push notifications in our ultimate guide.
In-App Loyalty Programs and Rewards
Mobile apps are an ideal home for your loyalty program, making it easy for customers to track and redeem rewards.
Brands can create a more gamified, engaging loyalty experience in-app:
Customers earn points for each purchase
They see progress toward the next tier or reward
They receive notifications when rewards are available
This convenience and visibility boost participation. 83% of consumers say being part of a loyalty program influences their decision to buy again.
Personalized Shopping Experience
Apps can offer a level of personalization that’s harder to achieve via the web alone.
By leveraging user data (browsing history, past purchases, preferences), the app can dynamically showcase tailored products and content.
Ecommerce apps excel at this: they can greet users by name, remember sizes or saved items, and even use AI to curate “just for you” sections. The result is higher engagement and more frequent shopping, as the app becomes like a personal storefront for each customer.
A Frictionless User Experience
A great app makes the post-purchase and ongoing shopping experience fast and frictionless, which encourages loyalty.
Friction makes shopping frustrating. Frustration reduces loyalty, and makes shoppers search for alternatives.
A smooth UX (quick load times, one-click reorders, easy payment options, and saved shipping info) removes barriers to purchase.
When customers find an app convenient and enjoyable, it becomes their preferred way to shop your brand, naturally lifting retention.
Community and Content Integration
Ecommerce apps can go beyond transactions to build a community around the brand. Some innovative DTC brands are embedding community features or content feeds in their apps to increase engagement.
An example is Gymshark launching the Gymshark Training app, which provides workout ideas and connects users in a fitness community, as a complement to Gymshark’s shopping app.
Beauty brands often integrate content like tutorials, blog posts, or customer looks into their apps. This gives customers reasons to open the app even when they’re not immediately buying something, keeping them engaged for longer.
Over time, this deeper engagement leads to higher retention because customers feel part of a like-minded tribe.
What Strategies Improve Customer Retention?
Here are some ways to actively drive higher customer retention for DTC brands.
Deliver Outstanding Customer Service
Customer retention starts with customer satisfaction. Ensure your support is responsive and helpful across all channels – app chat, email, social, etc.
Fast and friendly customer service significantly boosts repeat business. Gartner research found that when customers feel they received great service, there’s an 82% probability of buying again.
Train your team (or chatbot/AI assistants) to resolve issues quickly. A smooth return process can turn a potentially negative experience into a loyalty-building moment.
Launch a loyalty program to reward repeat customers.
This doesn’t have to be complex. Even a simple point-per-dollar and coupon reward system can work as a quick win.
The goal is to give customers a tangible incentive to choose you again. Loyalty programs both increase repeat purchase rates, as well as fostering emotional ties to the brand.
Consider tiered VIP levels (e.g., Bronze, Silver, Gold) to encourage progression. Brands with well-run loyalty programs see 15–25% higher annual revenue from their loyal customers.
Use Personalization and Segmentation
Avoid blasting the same message to everyone. Segment your customers and personalize communications to their behavior and preferences.
At a basic level, separate your one-time buyers from your repeat customers and communicate differently to each:
New customers might get a “welcome” series with a first-repeat-purchase discount
Loyal customers might get a “VIP sneak peek” of upcoming launches
In your app, use segmentation for push notifications: if a segment of customers only buys skincare, send them skincare content, not generic promos.
Done right, personalization shows customers you understand them, increasing their affinity for your brand.
Streamline the Reorder Experience
Make it as easy as possible for customers to buy from you again.
Sending replenishment reminders for consumable products
Offering subscribe-and-save options for eligible products
Optimizing your checkout flow for speed, especially on mobile
Enabling one-click checkout options
The less hassle a customer faces, the more likely they’ll come back rather than drift to a competitor.
Engage Customers with Content and Community
Building a sense of community can significantly improve retention, as customers feel they’re part of something bigger than a transaction.
Glossier famously built its brand on community engagement starting with its Into The Gloss blog, and now a fervent social community, which keeps fans emotionally invested.
You can do the same by creating content that resonates with your audience’s lifestyle or values:
Publish styling tips if you’re a fashion brand
Host live Q&As or how-to videos in your app
Create a forum for customers to share and discuss
Brand-run communities can turn customers into loyal fans who stick around for the community and identity, as much as the product.
Solicit Feedback and Act on It
Show customers that their voice matters. After the sale, ask for feedback through brief surveys or in-app prompts.
Not only can this uncover issues to fix (preventing silent churn), but closing the feedback loop makes customers feel heard.
Smart DTC brands use customer feedback in product development. This approach signals that you value the customer beyond their dollars, building loyalty.
Additionally, reach out to lapsed customers to understand why they haven’t come back. A friendly “we miss you” email (or push notification) with a small incentive can both win them back and reveal pain points.
Align Retention Tactics with Your Brand Identity
Make sure your retention tactics feel authentic to your brand. A common pitfall is copying generic tactics that don’t fit your brand’s ethos.
For example, if your brand is positioned on luxury and exclusivity, blasting big coupon codes might undermine that premium image.
Instead, focus on white-glove service and exclusive access as retention rewards.
Brand consistency matters. Retention efforts should enhance the customer’s connection to your brand story, not contradict it.
Learn more: Read how Country Life Natural Foods uses their mobile app to massage buyers along the path to becoming long-term, engaged buyers who stick around for life.
Common Retention Pitfalls to Avoid
Here are some of the ways brands commonly go wrong when trying to grow retention.
Over-Communication and Notification Fatigue
Bombarding customers with constant emails, texts, or push alerts can annoy them into quitting on you.
There’s a fine line between being engaging and being spammy.
Quality over quantity is key – a few well-timed, relevant touches beat a barrage of noise. Monitor unsubscribe rates and app notification opt-outs as warning signs.
Lack of Segmentation (One-Size-Fits-All)
Treating all customers the same will hurt your retention efforts. A new customer has different needs than a 5-time buyer.
Blasting the same offer to everyone reduces effectiveness, and feels impersonal or irrelevant. Avoid this pitfall by using even basic segmentation: by purchase history, demographics, or engagement level.
Segmentation and relevance are the antidotes to attrition. Customers stick around when the experience speaks to them.
Misaligned Retention Incentives
Ensure your retention tactics don’t inadvertently train customers to behave in ways that hurt your business. A classic example is over-reliance on discounts.
If every communication includes 20% off, customers might learn to never buy at full price.
Design your loyalty incentives to encourage the behaviors you do want (repeat purchases, referrals, higher basket sizes) and cap or exclude things that could be gamed.
Keep your program simple and aligned with value for both the customer and you. The best retention strategies deepen the customer’s connection to your brand’s mission, not just its wallet.
Ignoring Churn Signals
Don’t focus solely on happy repeat customers. Pay attention to those slipping away as well.
A pitfall is to pour all your resources into marketing campaigns without analyzing why customers churn.
Make sure someone on your team is actively reviewing churn metrics and qualitative feedback. Plug the leaks by addressing core issues: fix product problems, adjust pricing, or change your onboarding for better expectation-setting.
Set up win-back flows for lapsed customers. A friendly reminder or exclusive comeback offer can re-engage some of them.
What Are Some Quick Wins for High Retention ROI?
For teams with tight budgets or small staffs, focusing on a few high-impact, low-effort retention wins can deliver excellent ROI:
Optimize your thank-you and follow-up: After a first purchase, send a warm thank-you email with a next purchase coupon or useful content. This simple gesture can gently nudge a second purchase.
Re-engage with a “We Miss You” offer: Identify customers who haven’t bought in 90 days and trigger a win-back message with a small discount or personalized note.
Leverage Social Proof and Referrals: A referral program (e.g., “Give $10, Get $10”) can be a quick add-on that not only brings new customers but also retains the referrer by rewarding them.
Speed up your website/app: Improving page load times and reducing glitches in your app is an often overlooked retention win. A fast, easy shopping experience will quietly keep customers coming back.
Double-down on best sellers & subscription options: Analyze which products have the highest repeat purchase rates and make those prominent. Consider offering these as subscriptions in-app with a small discount.
What’s the Future of Retention?
Looking ahead, customer retention strategies are poised to become even more sophisticated:
AI and Predictive Analytics
Machine learning models can sift through customer data to predict churn before it happens, flagging which customers are at risk so you can stop them from churning.
In a privacy-conscious world, brands will lean heavily into zero-party data – information that customers proactively share with you, such as preferences or intentions.
Ecommerce apps will increasingly ask customers for this input through quizzes, style surveys, and wish lists. In return, brands will offer hyper-personalized experiences that keep customers loyal.
App-Native Communities
Gen Z and younger consumers are blending social interaction with shopping. Forward-thinking DTC brands may incorporate community feeds, user galleries, or live shopping events into their apps.
These community elements deepen engagement and give customers a reason to open the app even when they’re not actively shopping, which leads to more frequent purchases over time.
Lifetime Relationship Emphasis
Retention strategies will increasingly emphasize lifetime customer relationships over single transactions. We might see metrics like “10-year customer value” or “customer advocacy index” gaining prominence.
More brands may launch membership programs that bundle perks, content, and community, creating a moat of benefits that make leaving undesirable.
Retention: The Engine Behind Sustainable Growth
Acquisition gets the headlines, but retention wins the long game. A small boost in how many customers stick around can massively impact revenue. Why? Because repeat buyers, while often a minority, drive the majority of profits.
As ecommerce evolves, one thing stays the same: keeping customers coming back is essential.
For founders and marketers, the opportunity is clear:
Invest in customer experience.
Communicate thoughtfully (not endlessly).
Build real community.
Avoid cookie-cutter tactics. Personalization isn’t a nice-to-have – it’s the playbook. The brands that win treat customers like relationships, not receipts.
Mobile apps are proving to be retention goldmines. They offer what websites can’t – direct lines of communication, tailored experiences, and frictionless reordering.
You can launch your own mobile app now, for minimal effort and expense, just by converting what already works – your website.
If your brand has a mobile app, understanding your app acquisition costs is crucial for sustainable growth.
Cost Per Install (CPI) is one of the most important metrics to track when growing your mobile app user base. Keep reading and we’ll explain all you need to know about this key metric.
Vendrux helps you convert your website into a high-ROI mobile app, with minimal effort and overhead. Want to learn how? Start by getting a free preview of your app now.
What exactly is Cost Per Install?
Cost Per Install (CPI) is a key mobile marketing metric that measures how much you spend to acquire each new app install. It’s the average cost to get one user to download and install your mobile app through paid advertising.
This metric is especially critical for ecommerce and DTC brands with mobile apps because it directly ties marketing spend to user growth.
The less you spend to get users, the more profit you get from your app.
In a world where app users tend to be high-value customers, understanding and optimizing CPI is vital for launching apps that contribute real business results.
Want to know how much revenue your ecommerce app could add for your business? Our free Ecommerce App Revenue Calculator gives you an accurate estimate of what you stand to gain.
How do you calculate CPI?
Calculating CPI is straightforward. The formula is:
CPI = Total Ad Spend / Number of App Installs
For example, if you invest $10,000 in mobile ads and gain 3,500 new installs, your CPI is about $2.85 per install. This simple ratio tells you the average price of each acquired user.
In practice, marketers often calculate effective CPI (eCPI) after a campaign to evaluate performance. If you run multiple campaigns, you might compare their CPIs to see which channel or creative yielded cheaper installs.
A low CPI means you’re getting installs efficiently, whereas a high CPI means each user is expensive to acquire.
Consider this practical example: Imagine a DTC skincare brand runs a Facebook app install campaign with a $50,000 budget. If that campaign brings in 20,000 installs, the CPI is $2.50.
If another campaign on TikTok costs $30,000 and drives 15,000 installs, its CPI is $2.00. The marketing team would note that TikTok delivered a lower cost per install in this case and could allocate more budget there to scale user acquisition.
Why does CPI matter for ecommerce and DTC mobile apps?
For ecommerce and DTC brands, CPI isn’t just a vanity metric – it’s a window into customer acquisition efficiency.
Mobile app users are often highly valuable: they engage frequently, have higher conversion rates, and drive repeat business. If your brand’s app is a major sales channel, then scaling app installs can directly boost revenue.
But you need to acquire those users at a sustainable cost. This is where CPI guides your strategy.
Tracking CPI helps you ensure your user acquisition cost is in line with the revenue each user generates. It complements metrics like Average Revenue Per User (ARPU) and Lifetime Value (LTV) to ensure that revenue from app users exceeds the cost to acquire them.
For example, if your average customer spends $50 on your app over time (LTV) and your CPI is $5, you’re in good shape; but if CPI creeps up to $50, you’re paying as much as you earn, which is unsustainable.
CPI is also a diagnostic metric for campaign effectiveness. A relatively low CPI can indicate that your ads are reaching the right audience with the right message. A spike in CPI, on the other hand, might signal ad inefficiency or saturation of your audience.
Lastly, focusing on CPI can help drive rapid growth and visibility. A strong app install campaign can create buzz and propel your app up the app store rankings, leading to more organic downloads. This was important for many DTC brands launching apps – an early burst of installs improves app store visibility, which in turn attracts even more users without extra ad spend.
What are the key benchmarks and related metrics for CPI?
When evaluating CPI, it’s helpful to know industry benchmarks and related metrics.
What is a “good” CPI?
The answer varies by industry, platform, and region.
As of 2024, the average CPI for shopping/ecommerce apps tends to fall in the few-dollar range in mature markets.
For instance, North America’s average CPI for mobile apps is around $5 (reflecting higher competition and user value), whereas in regions like Latin America it can be well under $1.
Globally, Android app installs often cost less than iOS installs – one analysis showed Android’s average CPI around $1.2 versus about $3.6 for iOS apps.
These benchmarks underscore that what’s “normal” for one market may be high or low for another.
Related metrics
Other key metrics to track alongside CPI include:
Install Conversion Rate: The percentage of people who see your app ad or app store page who actually install. A well-optimized App Store page might convert ~3-5% of viewers into installers. Improving this conversion means more installs for the same spend, effectively lowering CPI.
Post-Install Conversion (Activation Rate): In ecommerce, a crucial metric is how many of those installs become purchasers. Industry data shows that only about 5-10% of new installers make a purchase. This conversion to first purchase is vital – if it’s low, even a cheap CPI won’t save your ROI.
Retention & Engagement: How many of your acquired app users stick around? Many brands monitor metrics like Day 7 or Day 30 retention rate for installs from each channel. CPI must be evaluated in context of user quality.
Cost per Purchase (CPP) or CAC: Some teams calculate a downstream metric like cost per first purchase or customer acquisition cost for app users. For instance, if your CPI is $4 and 10% of installers buy something, the cost per purchaser is $40.
In summary, know your baseline CPI for your sector and region, and keep an eye on how those installs translate into engagement and revenue.
The key is tracking a holistic set of metrics so you don’t optimize for cheap installs at the expense of business outcomes.
Strategies to optimize CPI
Tracking and improving CPI requires a strategic, data-driven approach. Here’s how seasoned marketing teams approach CPI optimization:
Set clear CPI targets aligned with ROI
Determine the maximum CPI you can afford while still making a profit per user.
For example, if an average app customer is worth $100 to you in lifetime revenue, you might set a target CPI of $10 or $20 to ensure a healthy margin.
Channel and campaign selection
Different advertising channels yield different CPIs. Social platforms, search ads, display networks, and influencer partnerships can all drive installs – but their cost efficiency varies widely.
Many businesses use a mix: broad reach channels for volume and niche channels for cost-efficient pockets of users.
Precise audience targeting
To lower CPI, focus your spend on audiences most likely to install (and eventually purchase).
Use lookalike audiences based on your best customers, retarget website visitors who haven’t downloaded the app, and tailor demographics to your buyer persona.
Companies can significantly reduce CPI by honing in on high-intent users.
Compelling creatives and app store optimization
Ads need to grab attention and clearly sell the value of your app.
Test different ad creatives – videos, images, copy – and see which drives more installs per impression.
App Store Optimization (ASO) is another crucial piece: ensure your app store pages have high-converting visuals, clear messaging, and strong social proof.
Leverage social proof and urgency
Highlighting positive reviews, user testimonials, or download counts in your ad or app store listing can nudge more users to install.
Similarly, creating a sense of urgency (e.g., “Limited-time 20% off first order in-app”) can improve conversion rates, effectively reducing CPI by increasing the install rate.
Retarget and re-engage
Don’t forget about those who showed interest but didn’t install, or those who installed but haven’t made a purchase.
Running retargeting campaigns can be a cost-effective way to boost installs and conversions.
Monitor and adjust bids and budgets
Keep an eye on CPI in each channel and campaign.
If one campaign’s CPI starts creeping up, adjust your bids. If another channel is delivering CPI below your target and users are high quality, consider scaling up budget there.
The goal is to find that sweet spot where you’re getting the maximum number of high-value users for the lowest cost.
Vendrux is more than just a website to app tool. We’re a full partner for your mobile app. We even help you craft a launch and promotional strategy to get app users, to ensure your app delivers actual results. Want to know more? Book a consultation now.
What can we learn from real-world DTC brand examples?
Real-world examples illustrate how CPI drives growth for DTC brands:
Aggressive user acquisition by new market entrants
In recent years, fast-growing shopping apps like Shein and Temu have exploded in user numbers by aggressively driving app installs.
They poured budget into mobile ads and referral incentives to acquire users at scale, accepting a higher CPI because they know a percentage will become big spenders.
Their example shows that if the LTV is there, even a substantial CPI investment can be profitable.
Boosting loyalty through app-only perks
Many DTC and retail brands use their app to foster loyalty.
Consider a brand like Sephora – they’ve promoted their app by integrating their loyalty program and offering app-exclusive deals and content.
While they might incur a cost per install in ads or promotions, those users typically have higher lifetime value due to repeat engagement.
Referral-driven growth campaigns
Some DTC brands have turned their customers into marketers by using incentivized referrals to drive app installs.
For instance, fashion resale platform Poshmark ran a “give $10, get $10” referral program. Many brands have used referral credits or friend-invite bonuses to successfully lower their effective CPI.
Looking ahead: Mobile acquisition trends to watch
The landscape of app user acquisition and CPI is evolving.
Future CPI optimization will demand that app marketers be more data-savvy and privacy-conscious in how they drive app growth.
CPI will remain a north-star metric for user acquisition, but the tactics to optimize it will evolve with technology and policy changes.
As you build your mobile growth strategy, remember that CPI is just one piece of the puzzle – it needs to be paired with user quality metrics and long-term ROI analysis to drive truly sustainable growth.


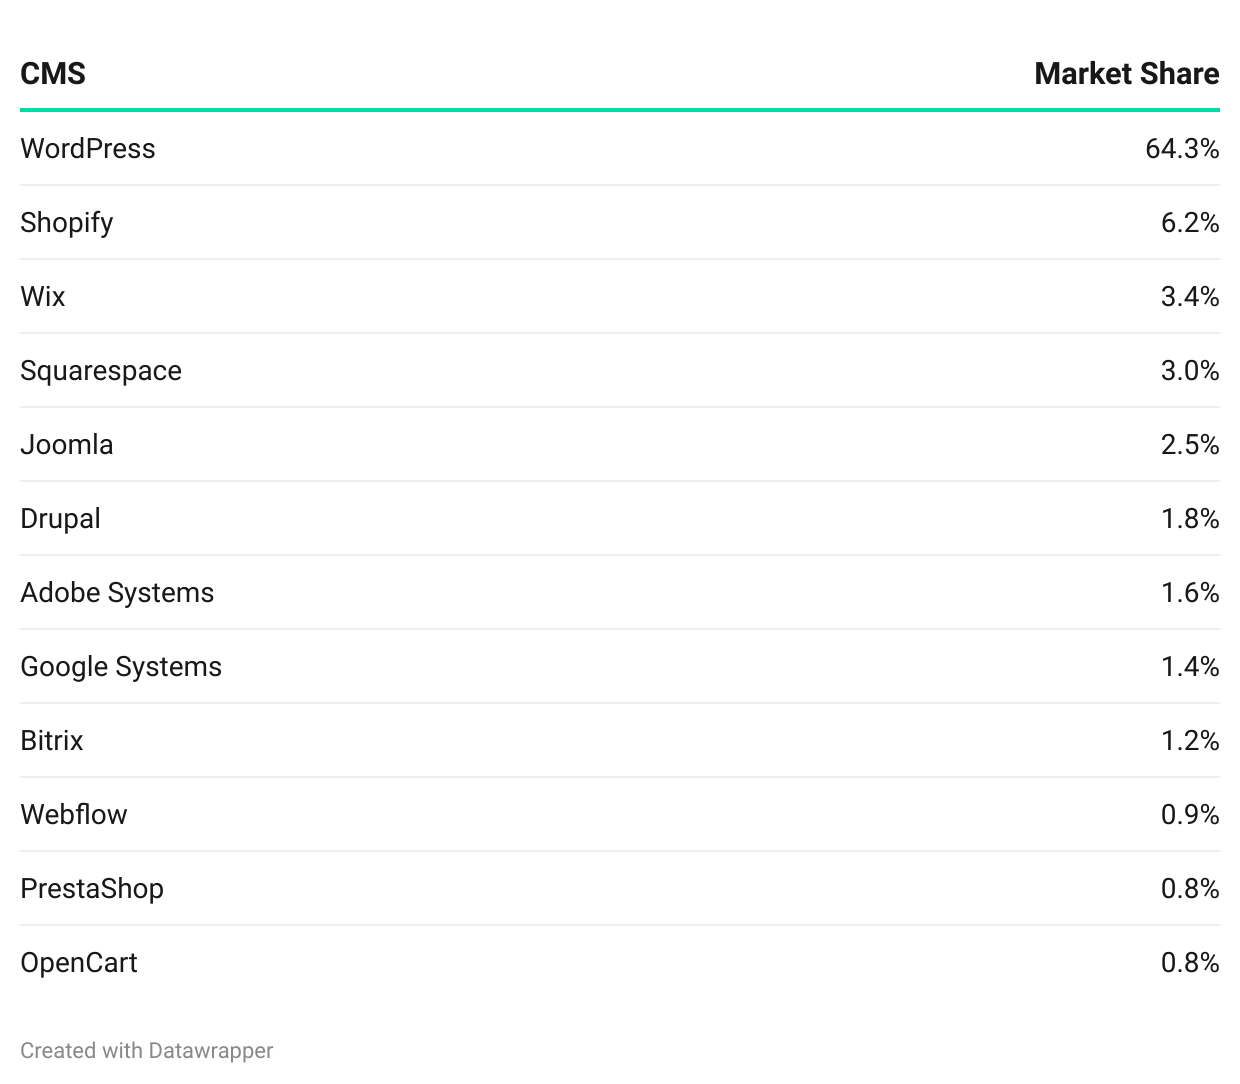

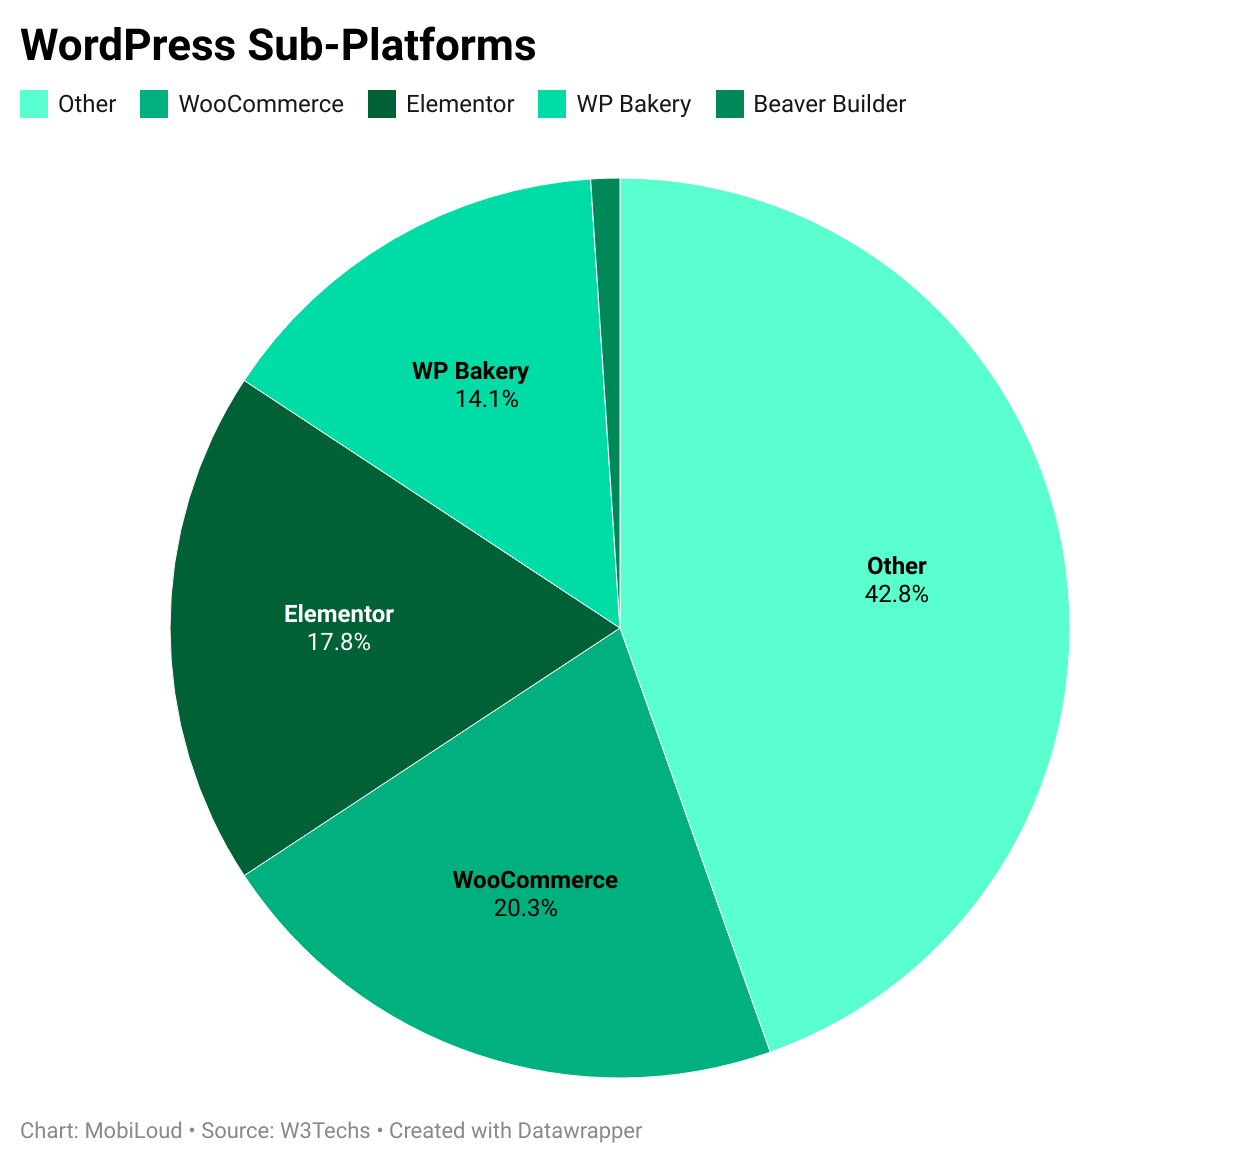

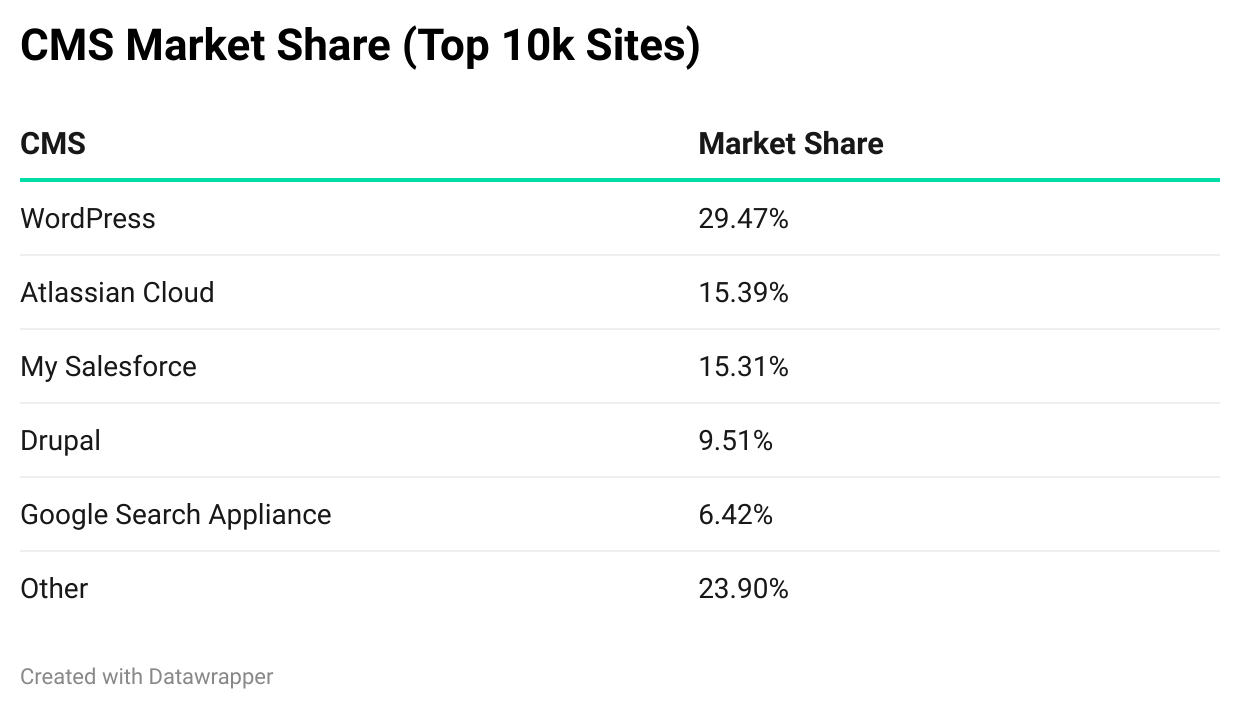
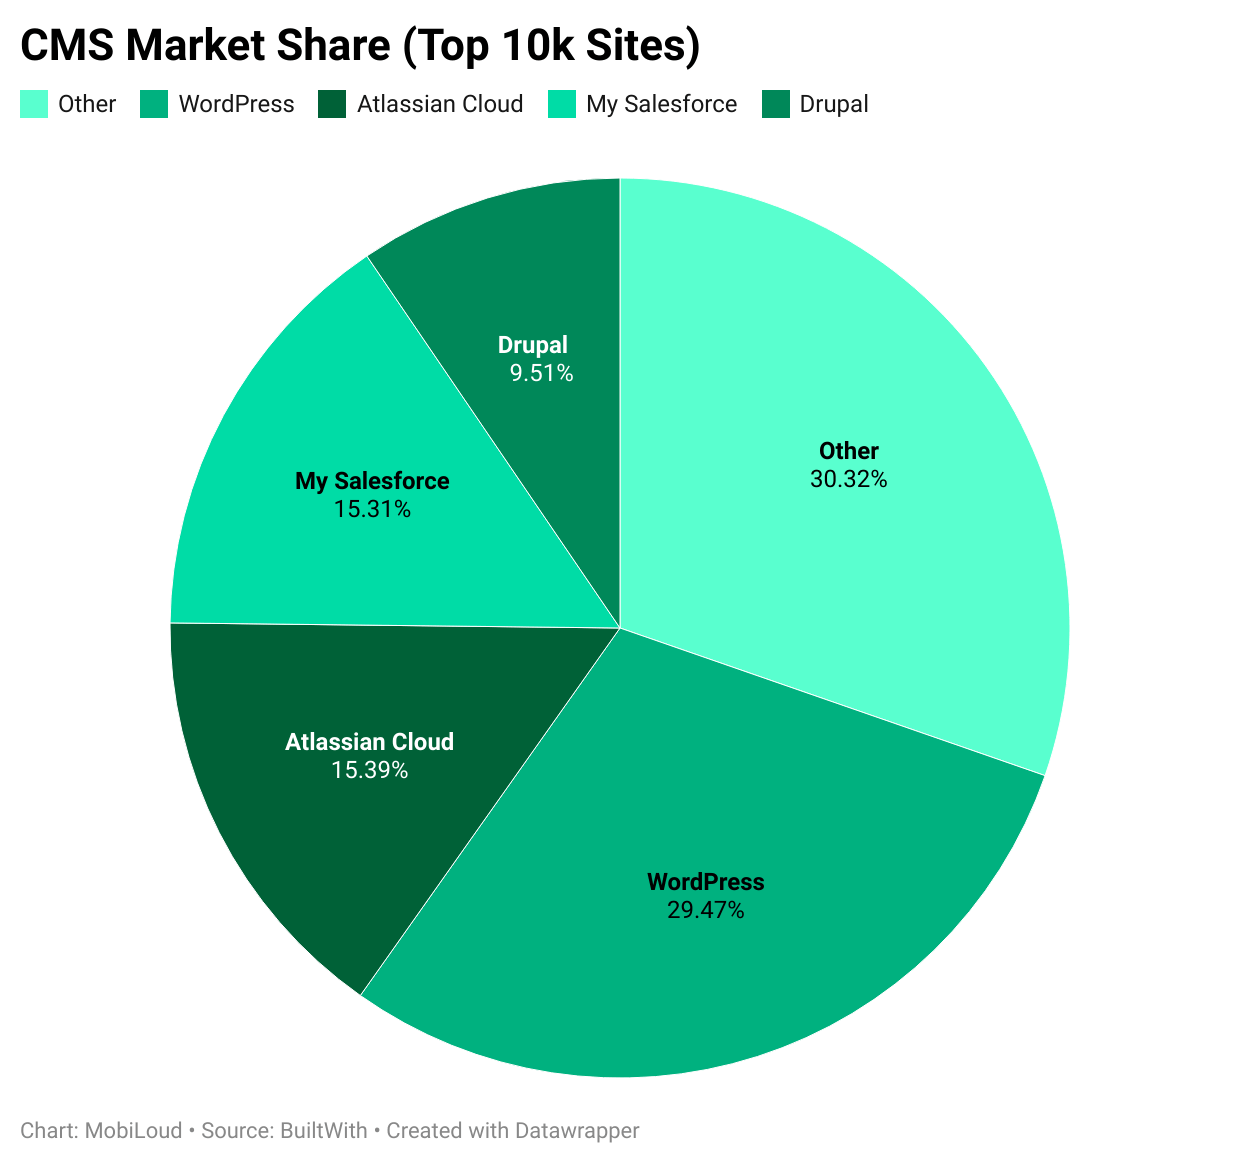
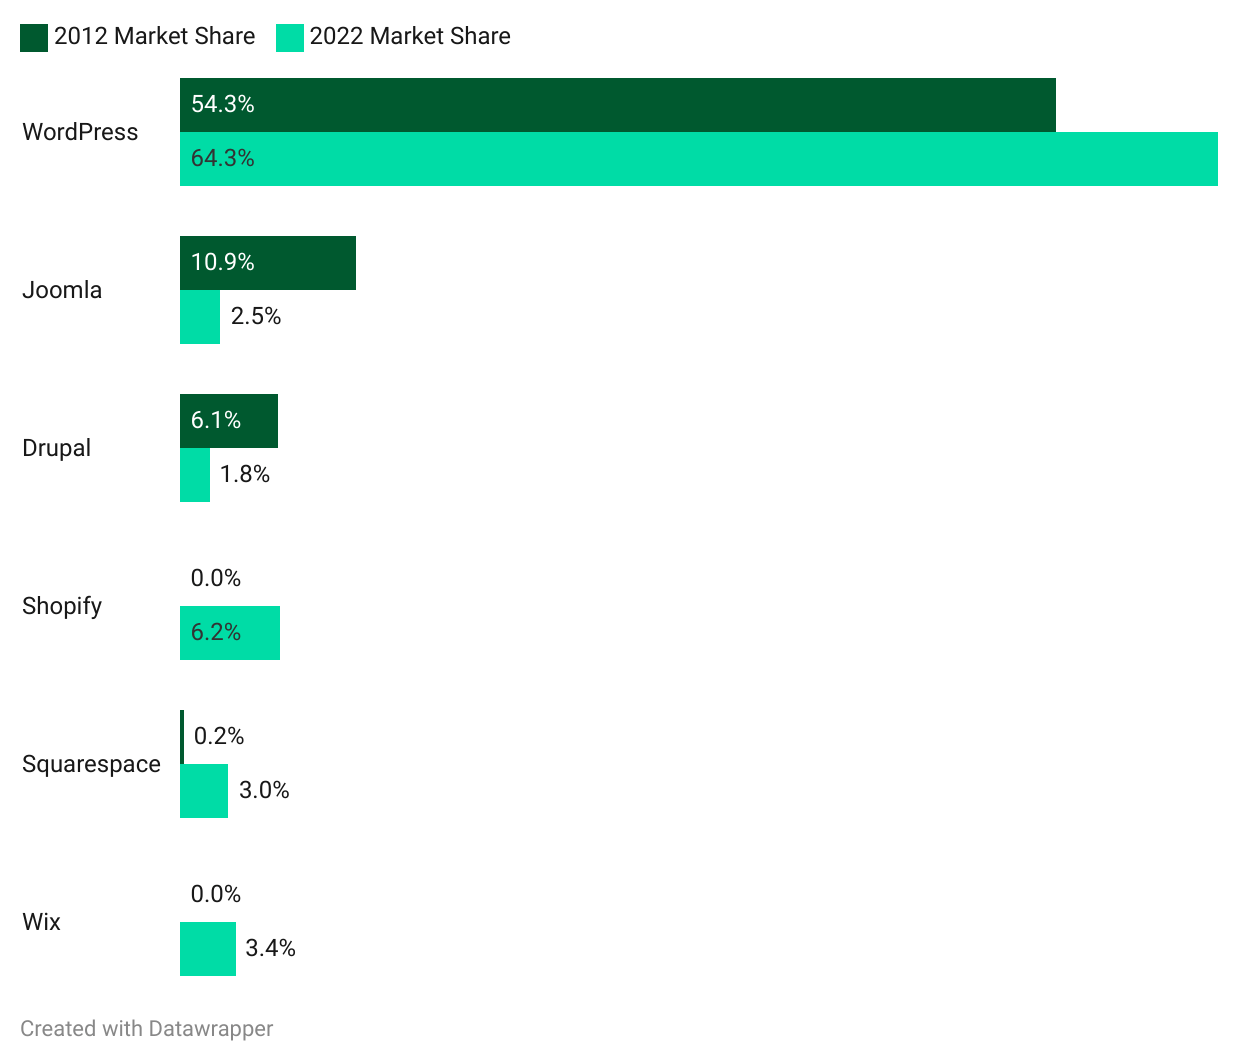
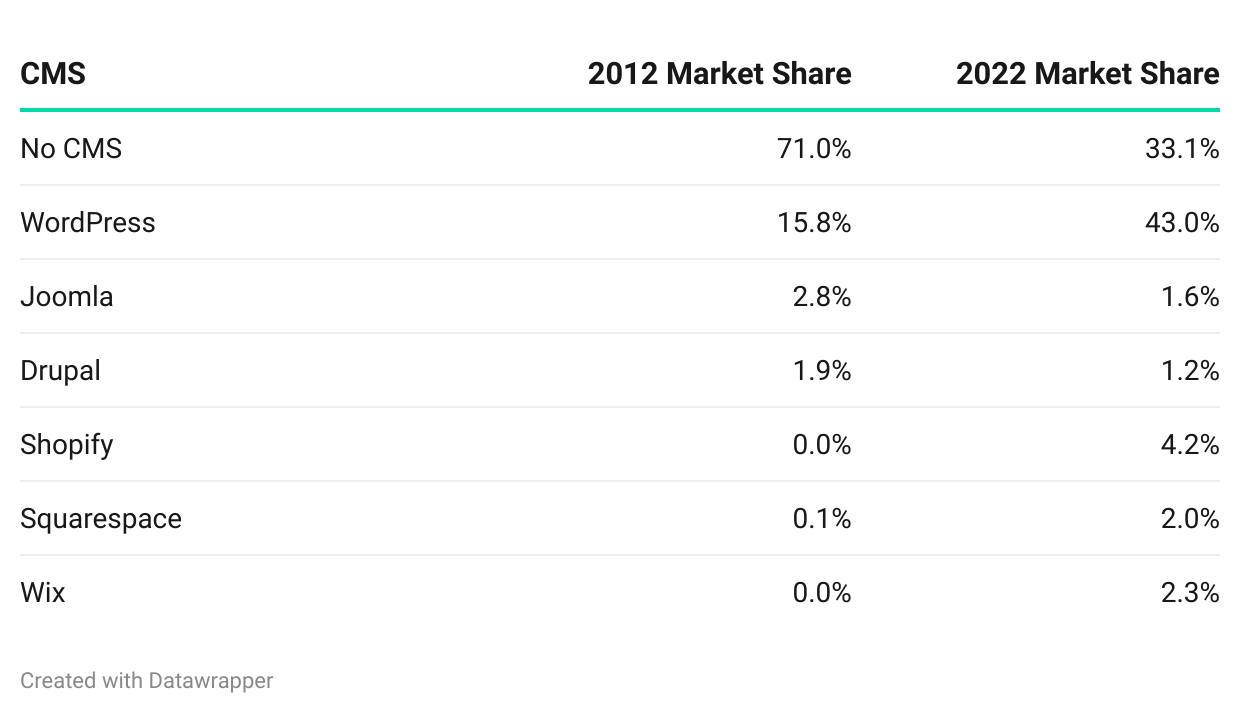

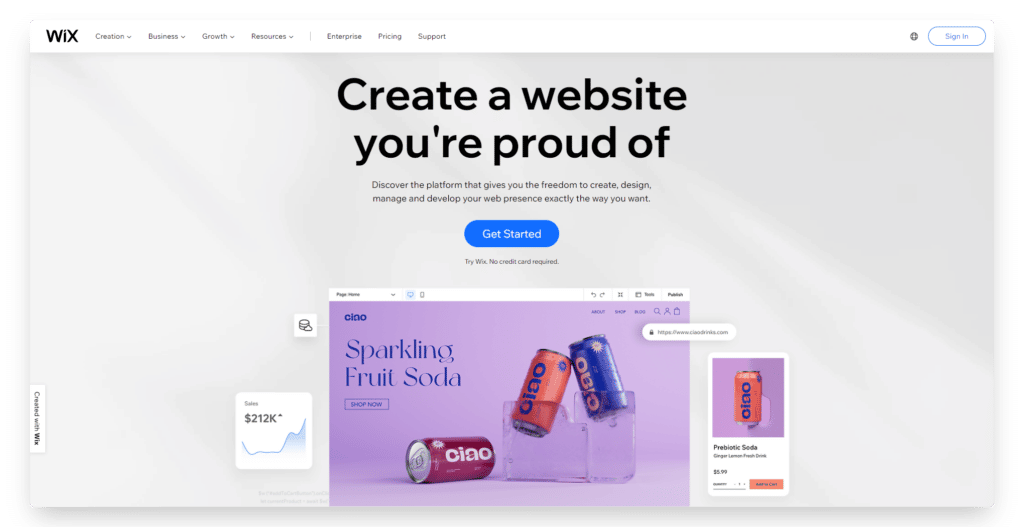

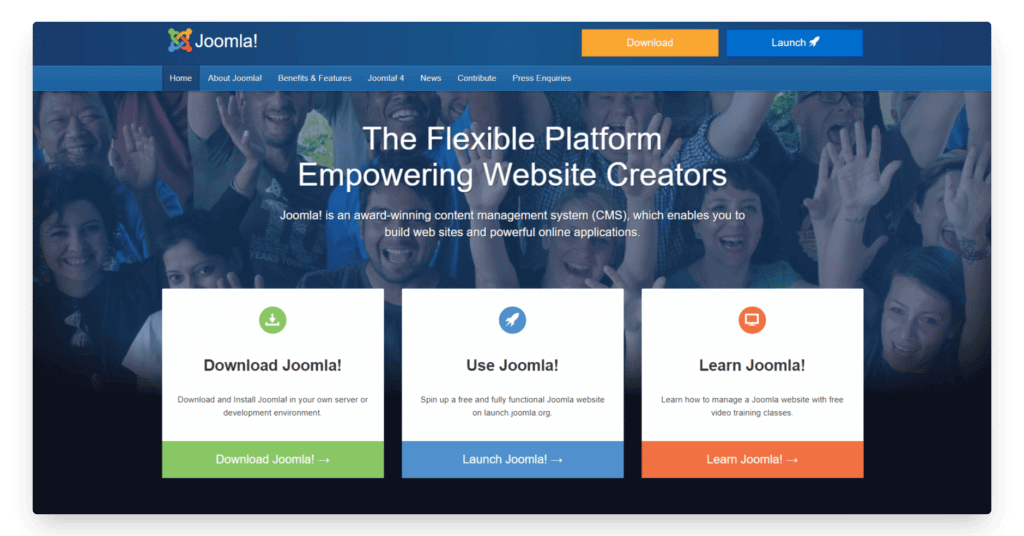
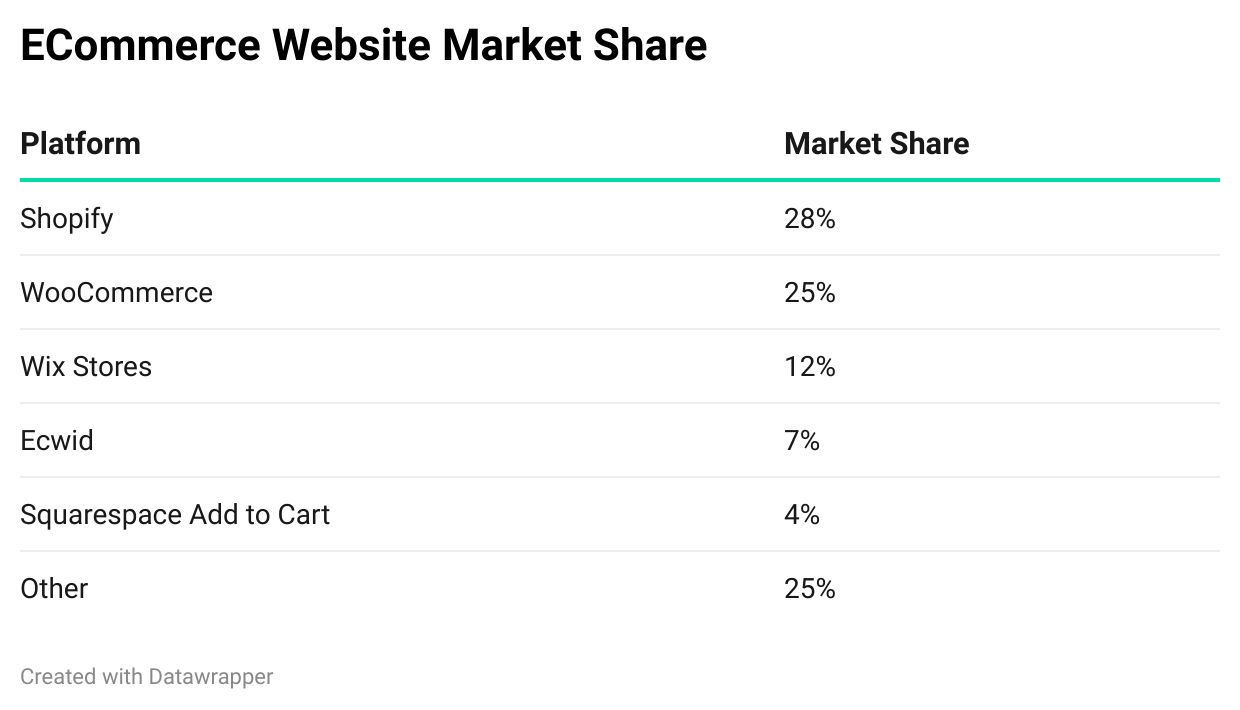
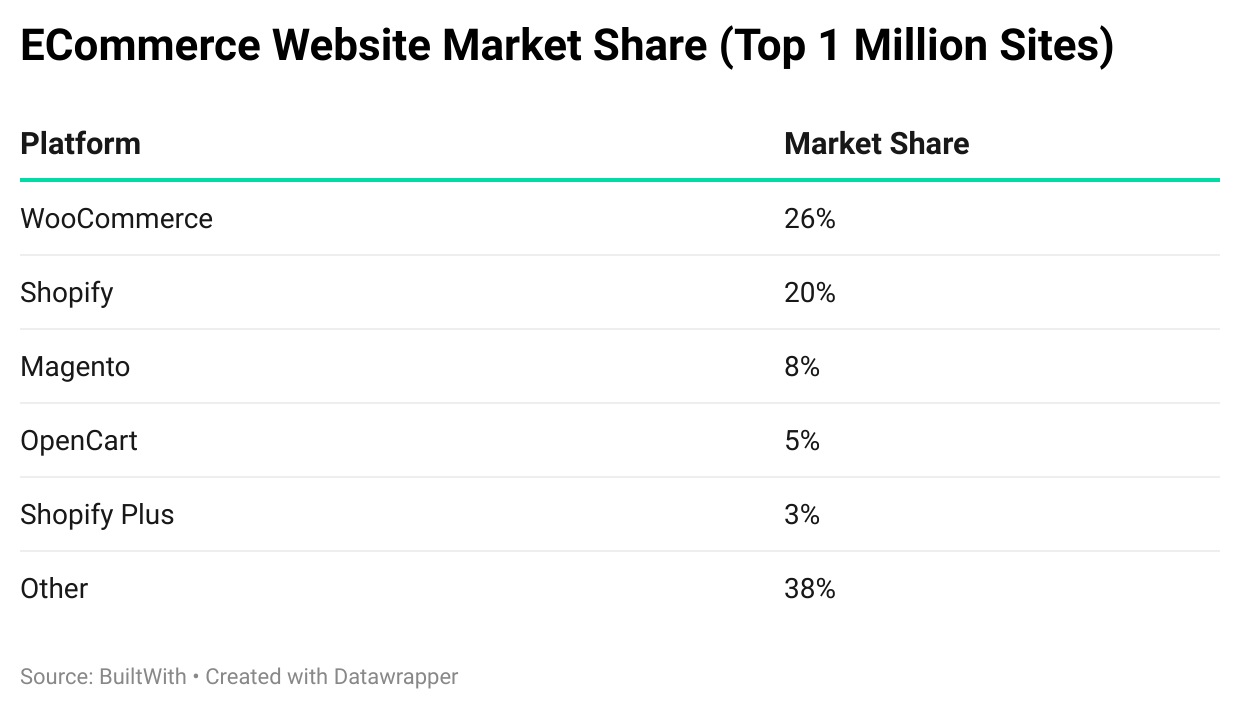

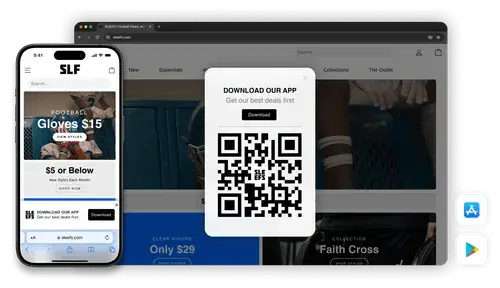


![What Percentage of Internet Traffic Is Mobile? [2026 Update]](https://wordpress.vendrux.com/wp-content/uploads/2026/05/6865a61ff863ded960713bf3_20250702T0914-c36ba916-cc94-47bb-b53d-01532e3ec13e-scaled.jpeg)