If you’re running a direct-to-consumer brand in 2026, you’ve probably felt the ground shift beneath your feet more than once.
The days of cheap Facebook ads and endless VC cash infusions are long gone, replaced by a landscape where profitability isn’t just a buzzword – it’s necessary if you’re going to survive.
Enter first order profitability, a metric that’s been thrust into the spotlight as DTC operators grapple with rising costs and shrinking margins.
But what does it really mean, why should you care, and how do you balance it with the holy grail of retention? Let’s dive in and learn more.
Want the latest insights into how 7, 8 and 9-figure brands are driving sustainable growth? That’s what you get with our weekly newsletter, The Retention Edge. Subscribe for free today.
What is First Order Profitability?
First Order Profitability is the ability to make a profit on a customer’s very first purchase after factoring in:
- Customer Acquisition Costs (CAC) – Ad spend and other costs to acquire a customer.
- Cost of Goods Sold (COGS) – What it costs to produce and fulfill the product.
- Shipping & Logistics Costs – Delivery, packaging, and potential returns.
- Payment Processing Fees – The unavoidable percentage platforms like Shopify, Stripe, or PayPal take.
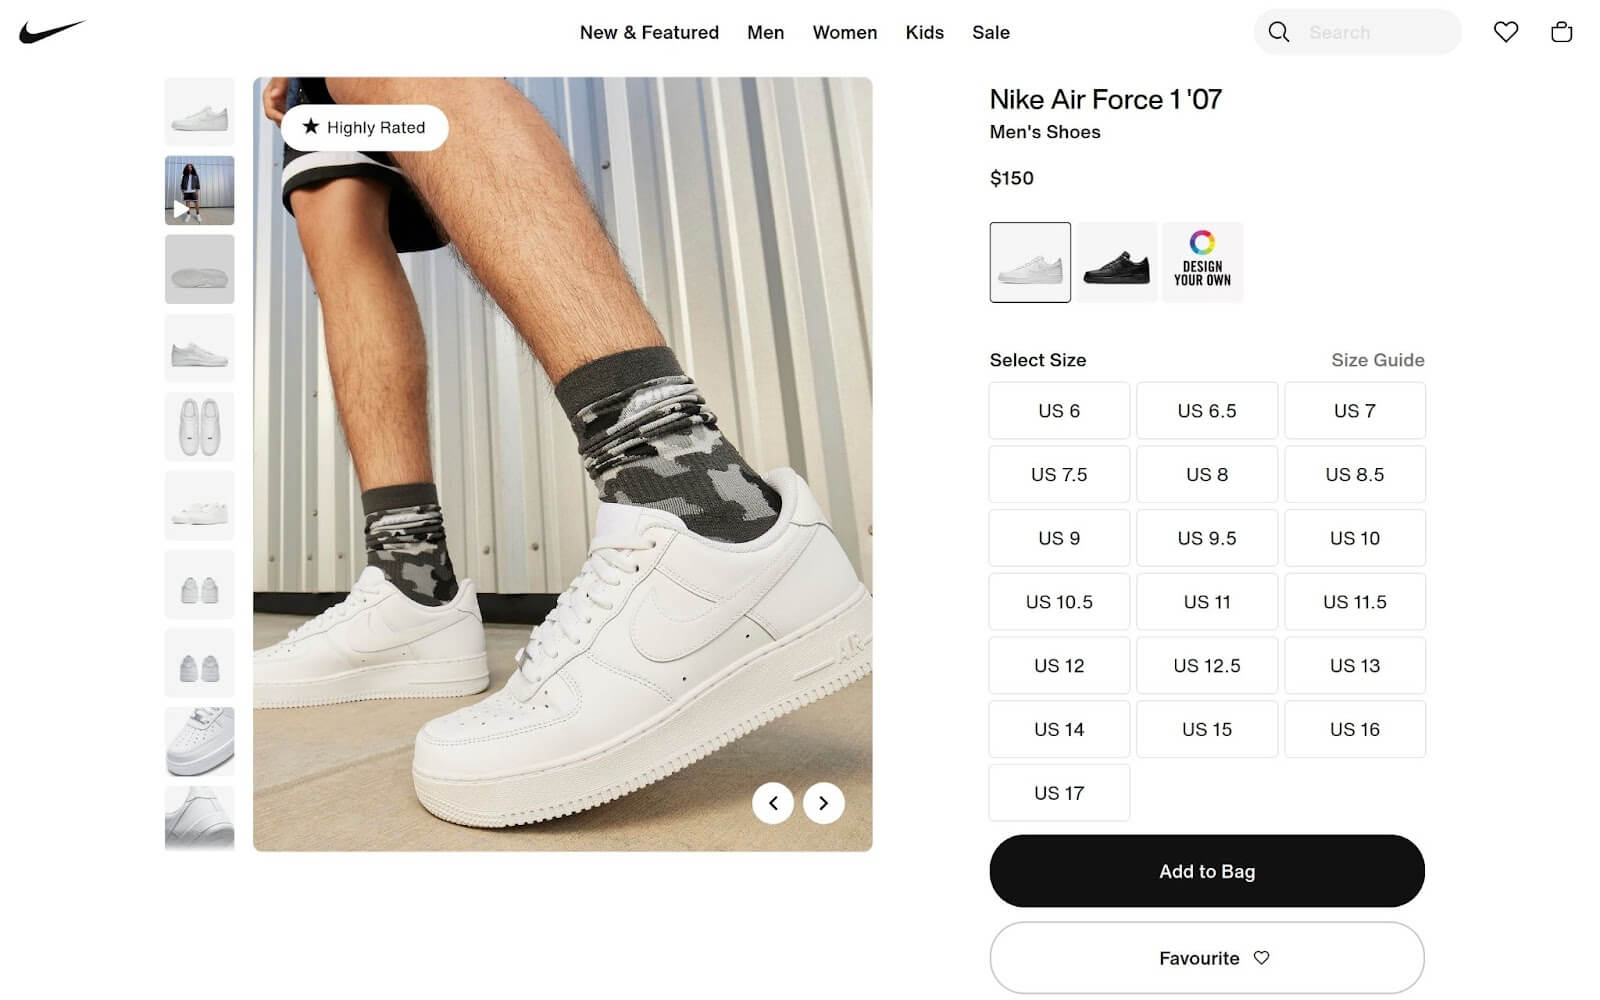
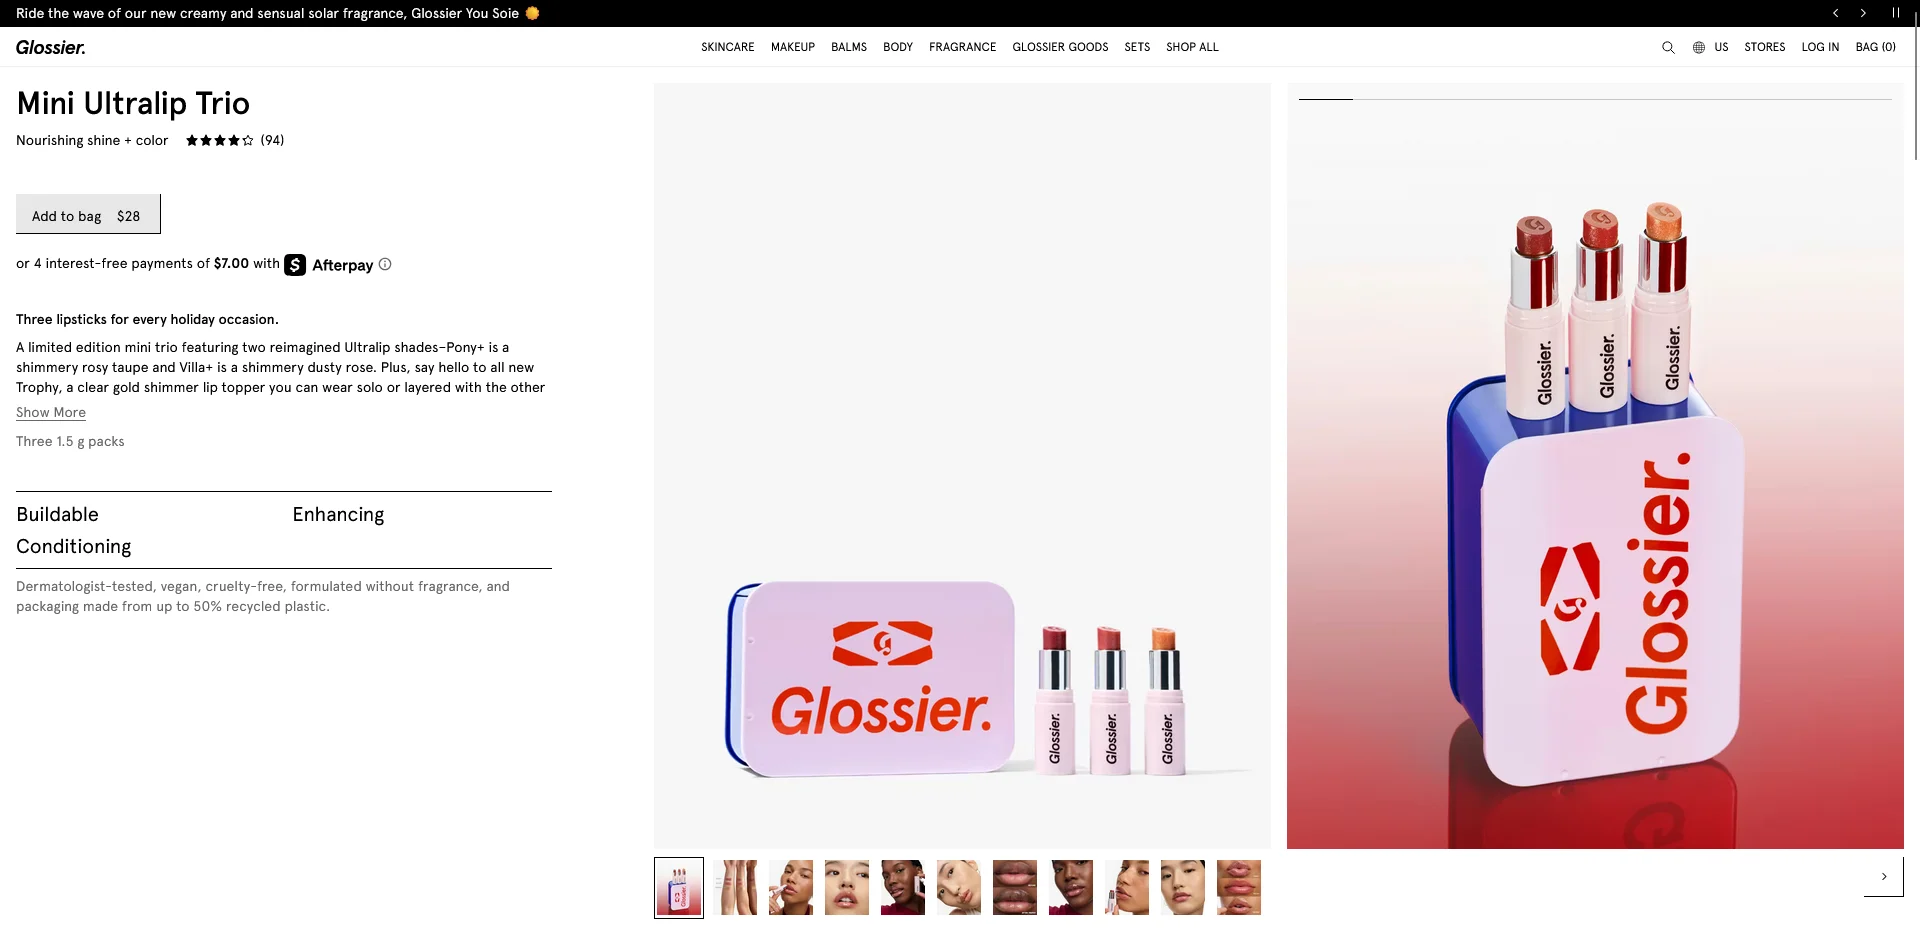
Picture this: a customer lands on your site, lured by a killer ad or a glowing recommendation. They buy your product (say, a $50 skincare set).
You celebrate the sale, but then the math kicks in. After subtracting CAC, COGS, and operational expenses like shipping or payment processing, are you still in the black?
If yes, congrats—you’ve achieved first order profitability.
If not, you’re banking on that customer coming back (preferably soon), or else you’ve lost money.
Brands that can profit on the first sale have a major advantage:
- They don’t rely on risky long-term payback periods.
- They reinvest profits into scaling faster, without burning cash.
- They have a clearer idea of the health of their business.
For years, DTC brands played the “spend now, profit later” game, assuming strong Lifetime Value would make up for high acquisition costs.
But post-iOS 14, the old playbook of “lose money now, make it up later” started looking like a shaky bet, leading to much more talk about the importance of making immediate profit.
Why First Order Profit is a Key Lever for DTC Brands
Cash flow is the lifeblood of any business, and first order profitability is like a turbocharger for your cash conversion cycle.
When you’re profitable on that very first sale, you’re not just waiting around for months (or years) to recoup your investment.
That money can go straight back into inventory, ads, or hiring the next rockstar team member.
In an era where venture capital isn’t raining down like it did in the 2010s, bootstrapped brands and cash-efficient operators are leaning hard into FOP to keep the lights on.
Retention is key for long-term profit and sustainability; but it can be hard to bank on revenue you haven’t realized yet.
There’s no guarantee that a new customer will meet your current LTV benchmarks, and there’s no guarantee that they’ll come back in the near future.
Thus if you can achieve a profit straight away, you’re in a safer spot to start thinking ahead to your next scaling move.
When First Order Profit Comes Second
While you’d always love to make a profit on your initial sale, there are situations where taking a loss on the first order makes strategic sense.
Some categories can afford to take a hit upfront because the backend payoff is so juicy.
It’s not that they don’t want to make a profit immediately; but competition in these industries tends to make it necessary to spend more to acquire new customers.
Here are the kinds of business which might not be thinking about first order profit as a priority.
Subscription & Consumables Brands (e.g., Supplements, Skincare, Coffee)
These brands know that if a customer buys once, they’re likely to buy again and again.
The real money is in LTV, not the first sale.
There’s also a predictable re-up cycle (e.g. a daily supplement might contain 30 servings, giving you a clear idea of when someone’s likely to repurchase), so it’s easier to plan ahead for when you’re likely to see CAC paid off.
High-LTV, Habit-Forming Products
With products like haircare, pet food, meal kits, coffee pods, razors, once a customer is in, they tend to stick.
These brands can afford a loss on the first sale if they’re confident in retention (and are big enough that they can weather those losses long enough for LTV to pay off).
Brands with Low CAC via Organic/Referral Growth
Then there’s the lucky few with strong organic acquisition.
If your brand’s killing it with user-generated content, referrals, or SEO, and customers are practically falling into your lap at low cost, negative first order profitability might not keep you up at night.
Think brands like Feastables (MrBeast’s chocolate); high organic traffic = lower CAC = easier to sustain lower first order profitability on paid ads.
These brands will often use that advantage to pump more money into paid ads and run aggressive acquisition strategies that lose money up front, but drive wide brand recognition that scales long-term.
Brands Playing with VC Money
Brands with millions of VC backing, can afford to throw buckets of money at ads to drive growth at whatever cost is necessary.
However this is becoming rarer and rarer in DTC today. Funding is drying up, and those brands that did follow the “growth at all costs” playbook are finding it difficult to transition to a profitable operating model.
Where First Order Profitability is Essential vs Where It’s Optional
Where your brand sits on the business model spectrum dictates how much you should obsess over making a profit on the initial sale.
For some, it’s non-negotiable. For others, the winning strategy may be to overpay for acquisition, because the long-term repeat purchase value is so high.
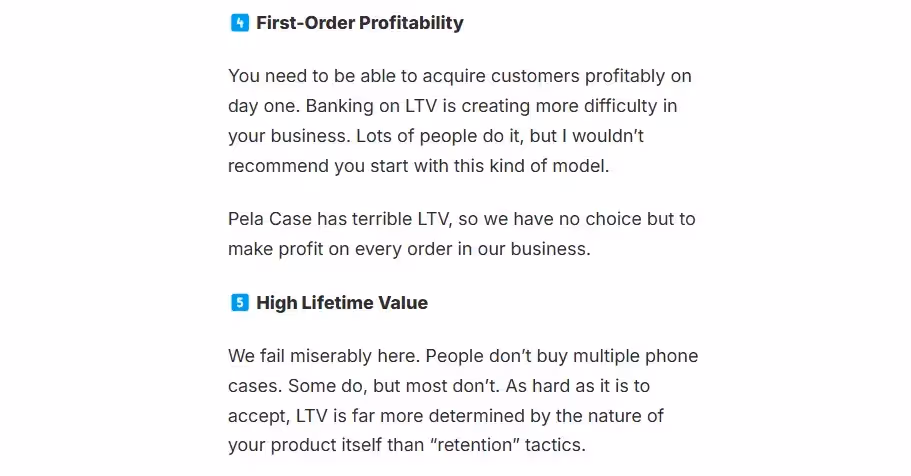
For example, Matthew Bertulli, CEO of Pela Case, explained how first order profitability is vital for his business, as they don’t have the reliable repeat purchase rates to justify losses on the initial sale.
✅ Must-Have FOP:
- One-Time Purchase Categories
- Mattresses (Casper, Purple)
- Luxury goods (high-end watches, jewelry)
- Wedding-related products (rings, accessories, gifts)
- Low-Repeat Categories
- Novelty products (customized gifts, holiday items)
- Niche DTC (one-off high-ticket gadgets)
- Businesses with Weak Retention Pathways
- If your AOV is low and there’s no strong upsell, FOP is non-negotiable.
❌ Can Lose on First Order:
- Subscription-heavy brands (e.g., Daily Harvest, Ritual, Hims)
- CPG with strong repeat purchase behavior (e.g., Magic Spoon, Athletic Greens)
- Membership-based models (e.g., Costco, ButcherBox)
Why You Won’t Scale With First Order Profitability Alone
Making a profit on the first sale is great, but you don’t want to fall into the trap of optimizing everything around this, and ignoring LTV.
First order profitability keeps the lights on, but LTV is how your brand scales, and withstands bumps in Meta ad costs and underperforming ad campaigns.
Obsess over the initial profit too much, and you risk building a business that’s all about short-term wins, but falls apart when the landscape gets tougher and CAC goes up.
Without retention, you’re stuck on an acquisition treadmill—constantly chasing new customers to replace the ones you couldn’t keep.
The most successful brands find a balance between both initial profit and long-term revenue, and once they have enough of a buffer, start to funnel more focus (and investment) into retention.
The Sustainable Scaling Playbook
Here’s how you keep your brand in business, but build the stage for long-term, sustainable growth and high LTV.
Do the following to improve first order profitability:
- Boost AOV with bundles, cart drawer and post-purchase upsells and personalized product recommendations.
- Constantly test new ad creatives to optimize ads and get CAC down.
- Limit discount offers (experiment with other incentives, such as free content or gifts).
- Don’t offer blanket free shipping (optimize your free shipping threshold to increase AOV).
- Invest in UGC and affordable traffic channels (e.g. SEO) that drive cheap traffic and offset more expensive acquisition campaigns.
At the same time:
- Add complementary product lines and subscription offers that increase repeat purchases.
- Work on bottom of funnel traffic generation to build your email & SMS lists.
- Set up automated email & SMS sequences (welcome sequences, abandoned cart, post-purchase, winback campaigns) that run on autopilot.
- Funnel your top customers into branded communities and mobile apps (driving more engagement from your top spenders).
If you have healthy first order profitability and dependable retention revenue, DTC is a great game to be in.
Final Thoughts: Play to Your Strengths
So, as you tweak your ad budgets, rethink your pricing, and test those checkout flows, keep the big picture in mind.
First order profitability matters. It’s your ticket to cash flow and stability in a brutal market.
But in the long-term, retention matters just as much.
If your brand can balance the two, you’ve got a good chance at not just staying afloat, but winning.


![Ecommerce Platform Market Share in the USA [Updated 2026]](https://wordpress.vendrux.com/wp-content/uploads/2026/05/6992e2118fac8921fbead8b6_shopify.webp)

.webp)
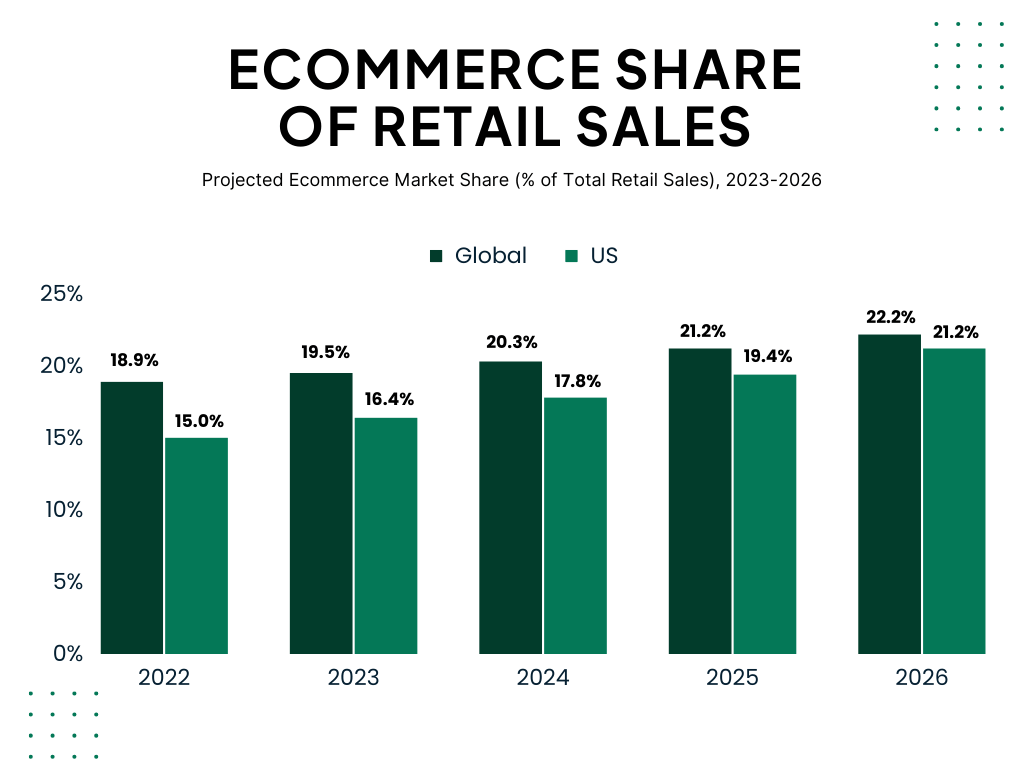
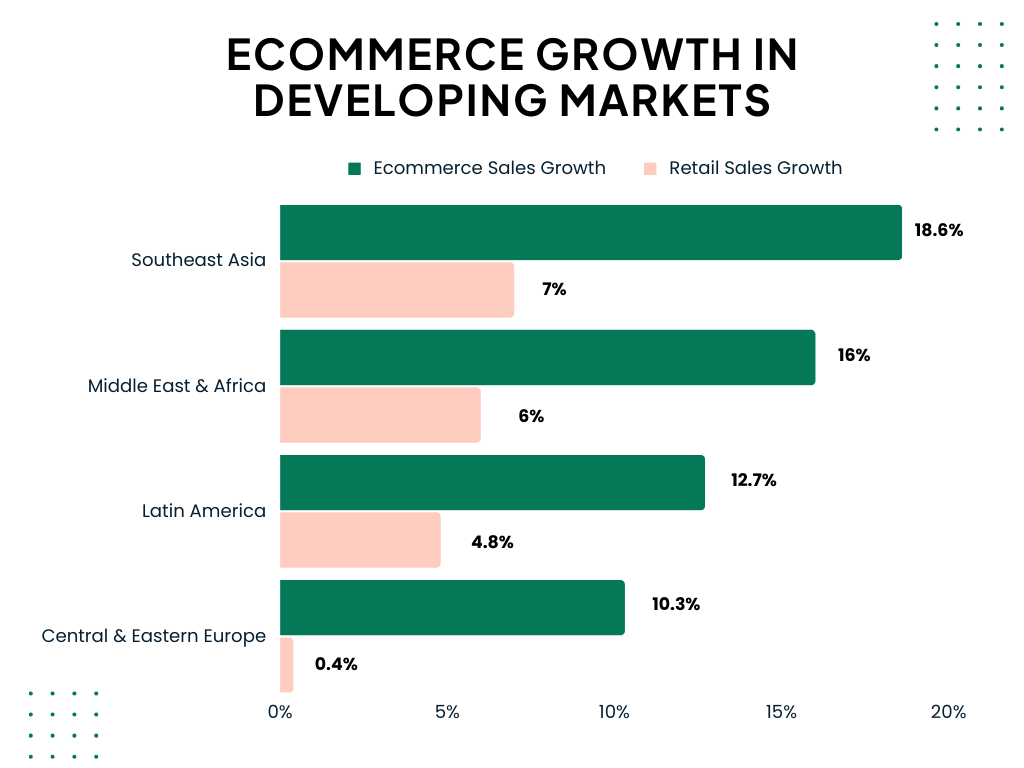
![Ecommerce Share of Retail Sales [Updated 2026]](https://wordpress.vendrux.com/wp-content/uploads/2026/05/6865a5e44c22637324b28b16_20250702T0917-38692da4-eeb0-4cef-ba70-ac7178f16643.png)